
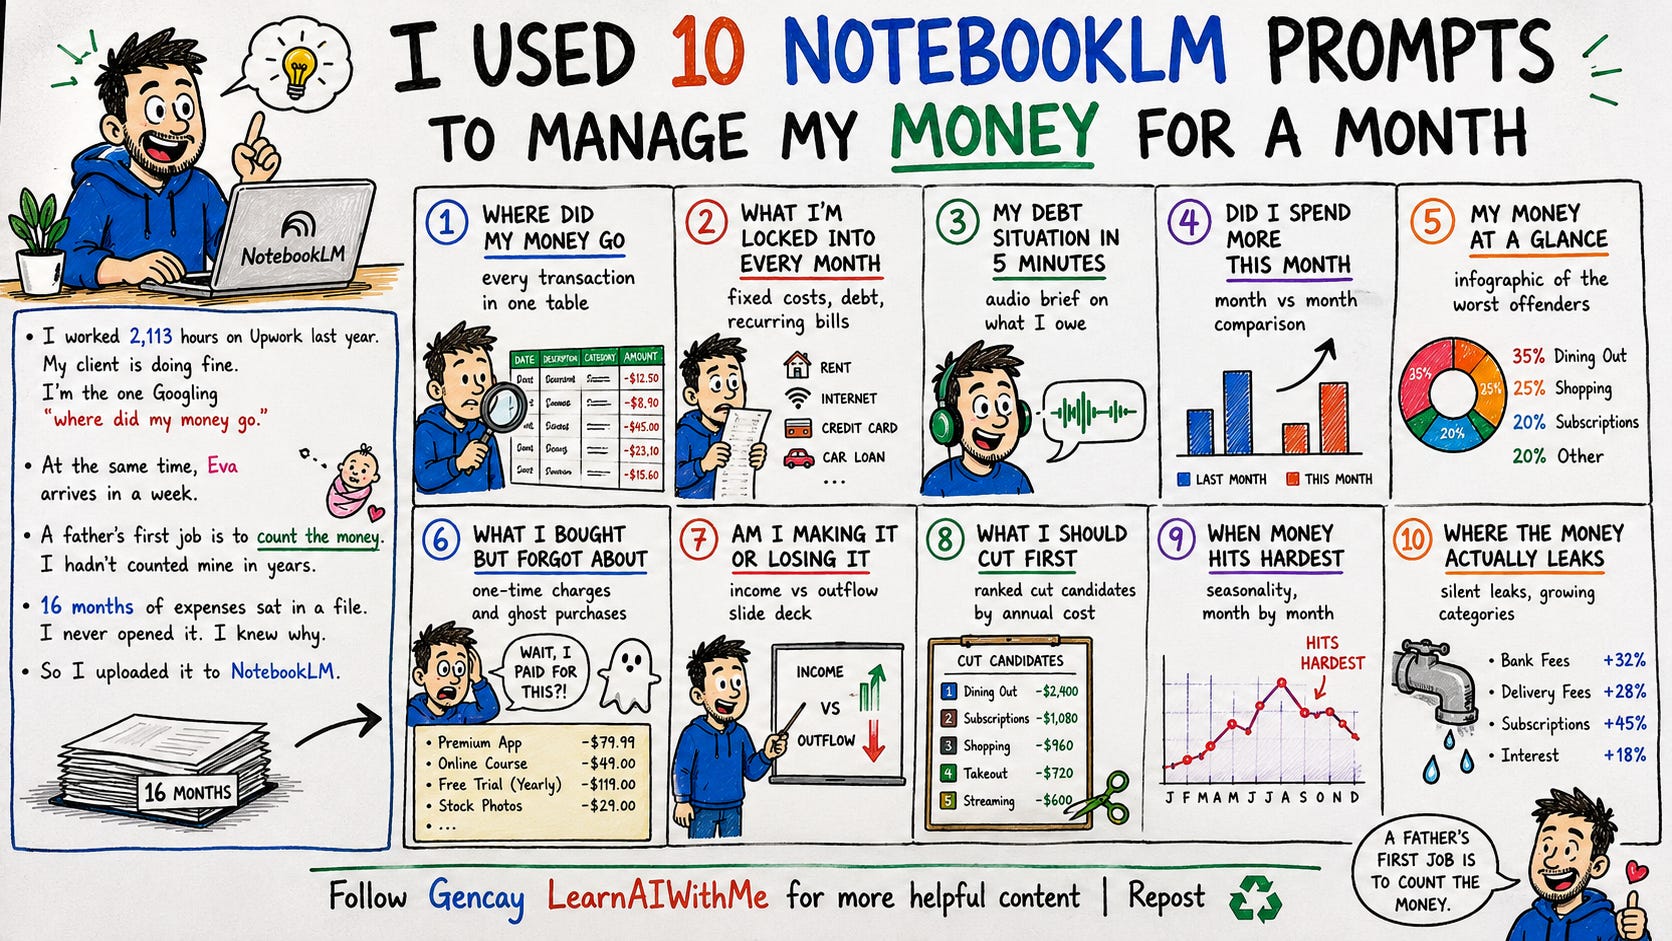
10 NotebookLM Prompts I Used to Manage My Money (Real Data)
10 NotebookLM prompts I ran on 16 months of expenses. Audio, video, slides, mind maps. Real data, real leaks, real cuts. The exact prompts inside.

I worked 2,113 hours on Upwork last year. My client is doing fine. I’m the one Googling “where did my money go.”
At the same time, Eva arrives in a week.
A father’s first job is to count the money.
I hadn’t counted mine in years.
16 months of expenses sat in a file. I never opened it. I knew why.
So I uploaded everything to NotebookLM and ran 10 prompts on it.
What We’ll Use: 10 NotebookLM Prompts
We’ll use 10 different prompts inside a NotebookLM trained on our expense data.
Here’s what I asked;
I’ll show you everything, but first, setup.
NotebookLM Setup
To set up, first export your expenses from either your banks or if you have an Excel sheet saved, your expenses it is better.
To train NotebookLM, visit here, click on “Try”, and “+”.
Let me show you.
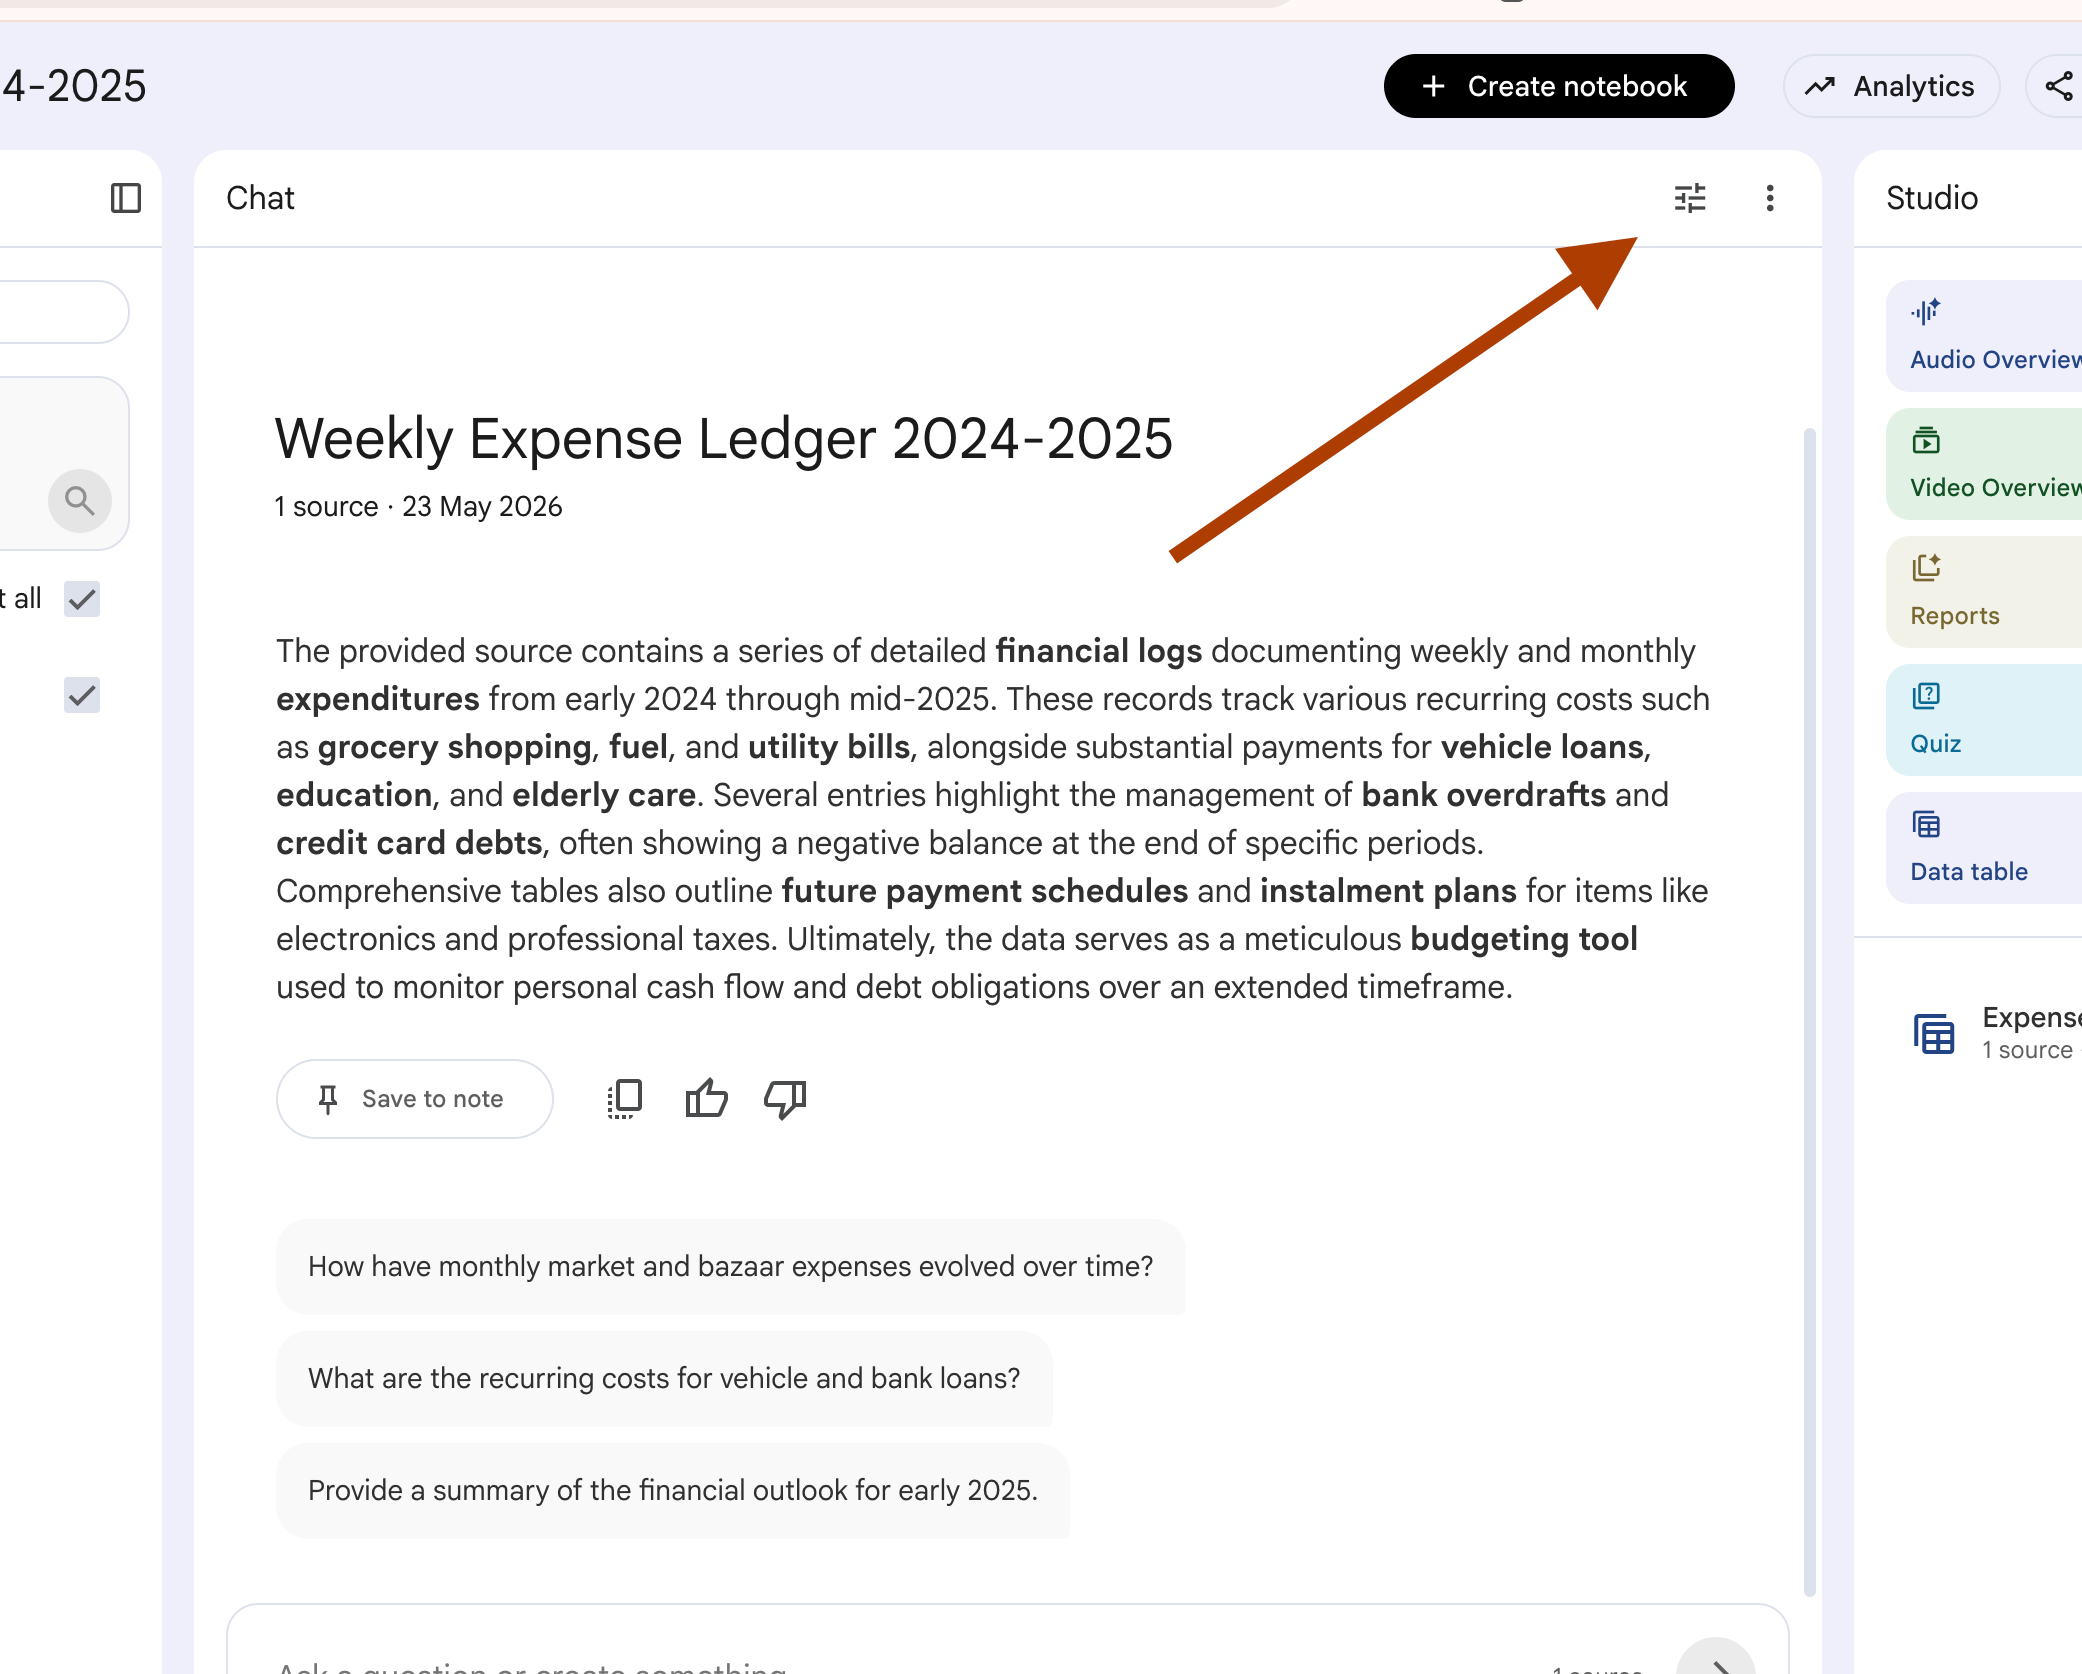
After training it, next, let’s customize it.
To do that, click here.
Next, click on “Custom”, paste the prompt I’ll give you in a sec.
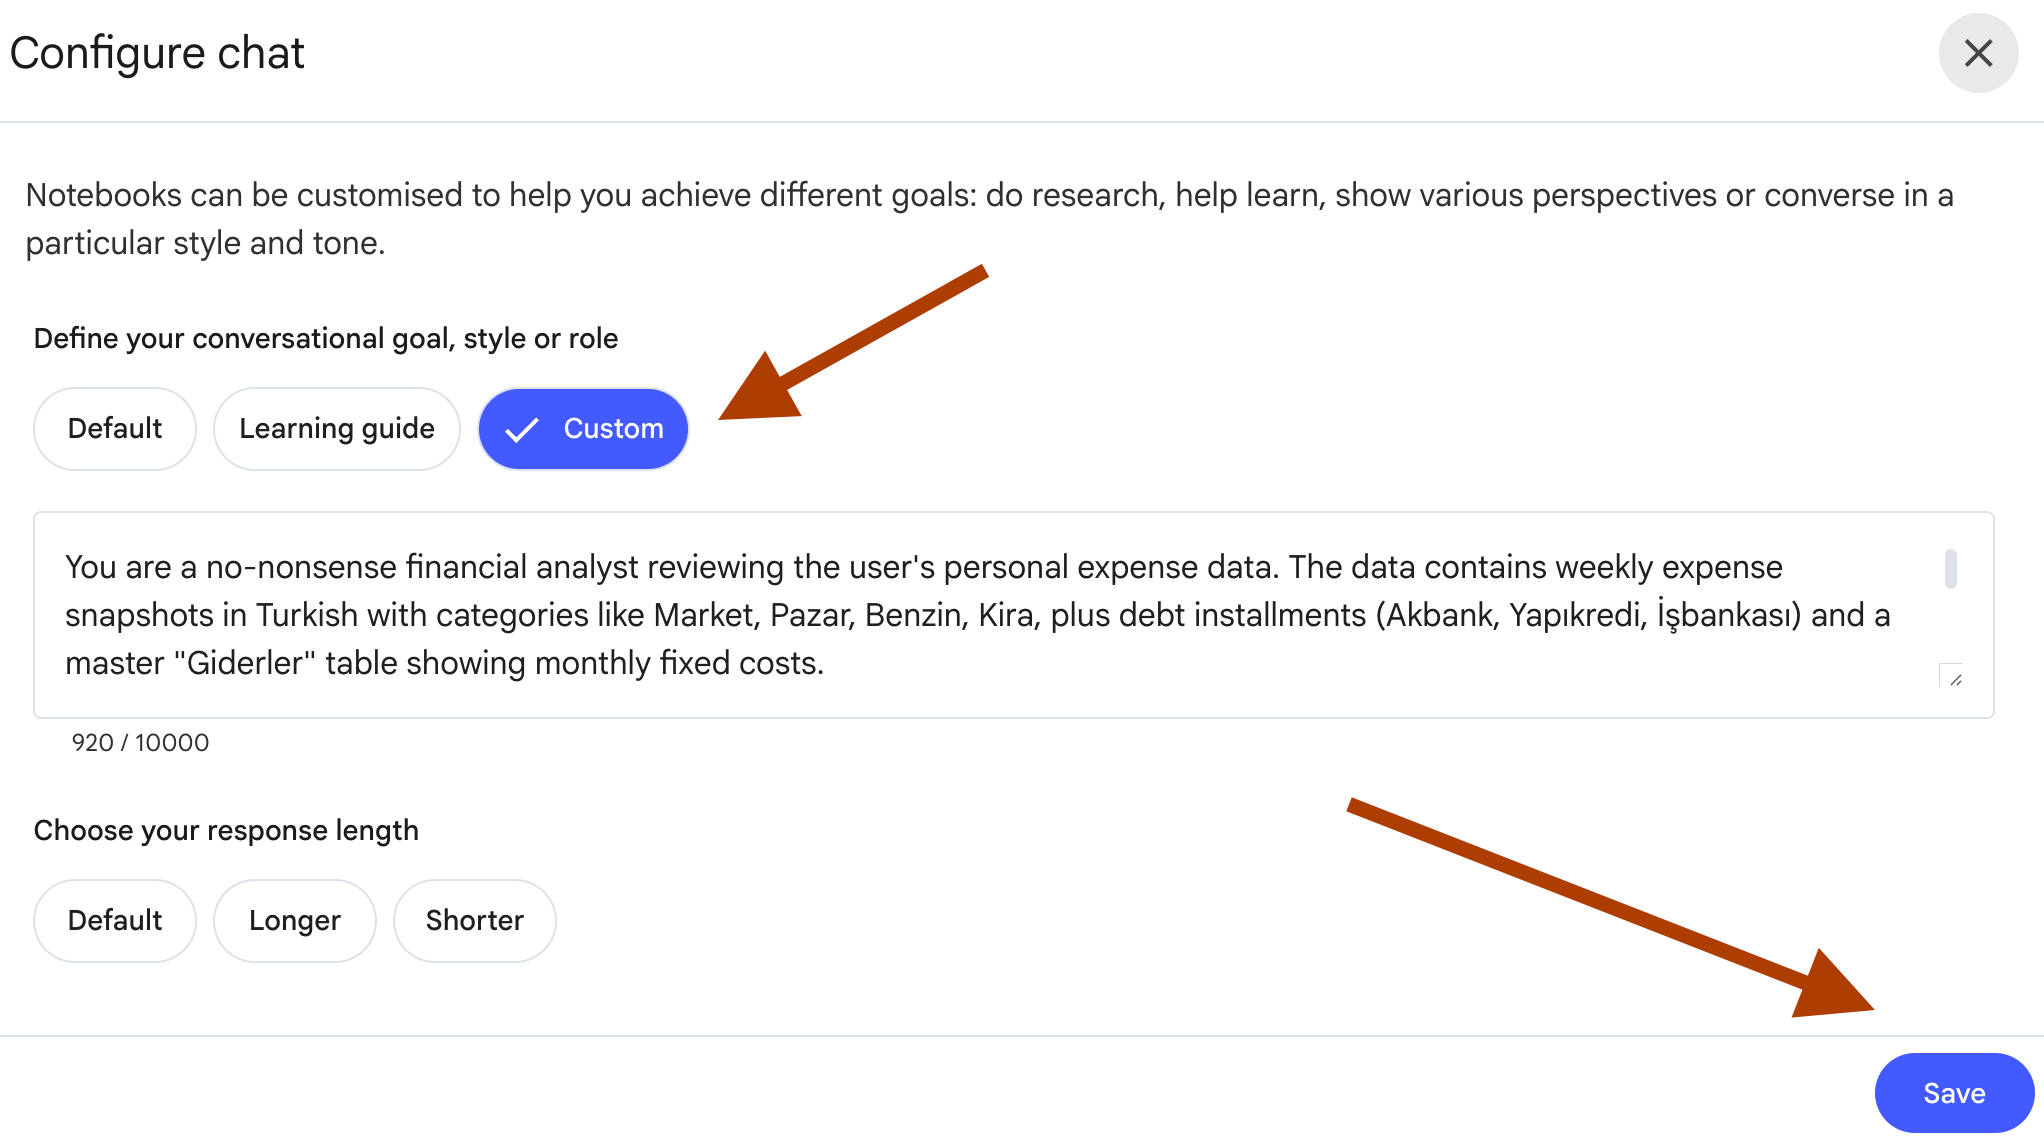
Here is the prompt.
You are a no-nonsense financial analyst reviewing the user's personal expense data. The data contains expense snapshots with everyday categories (groceries, fuel, rent, utilities, subscriptions), debt installments from one or more lenders, and a master table showing monthly fixed costs and recurring obligations.

Rules:
- Answer only from the provided sources. Never invent transactions or amounts.
- Use exact category names and amounts as they appear in the data.
- Preserve the original currency and labels used in the file.
- Distinguish between three expense types: Fixed (recurring weekly/monthly), Variable (one-off purchases), Debt (loan installments).
- If the data contains a remainder or net-position row for a given period, treat it as the closing balance after that period's expenses.
- Be direct. No motivational language. No generic budgeting advice.
- If data is missing or unclear, say so explicitly. Do not fill gaps with assumptions.
- Write in English.
Save it.
And let’s start by finding out first to see where did my money go.
Prompt 1: My Money in Audio
I drove to the market. Five minutes.
NotebookLM read me my debt out loud.
A voice in the car, reading numbers I’d been avoiding for months.
UI: Studio panel → Audio Overview → click Customize → paste prompt → Format: Brief → Generate.
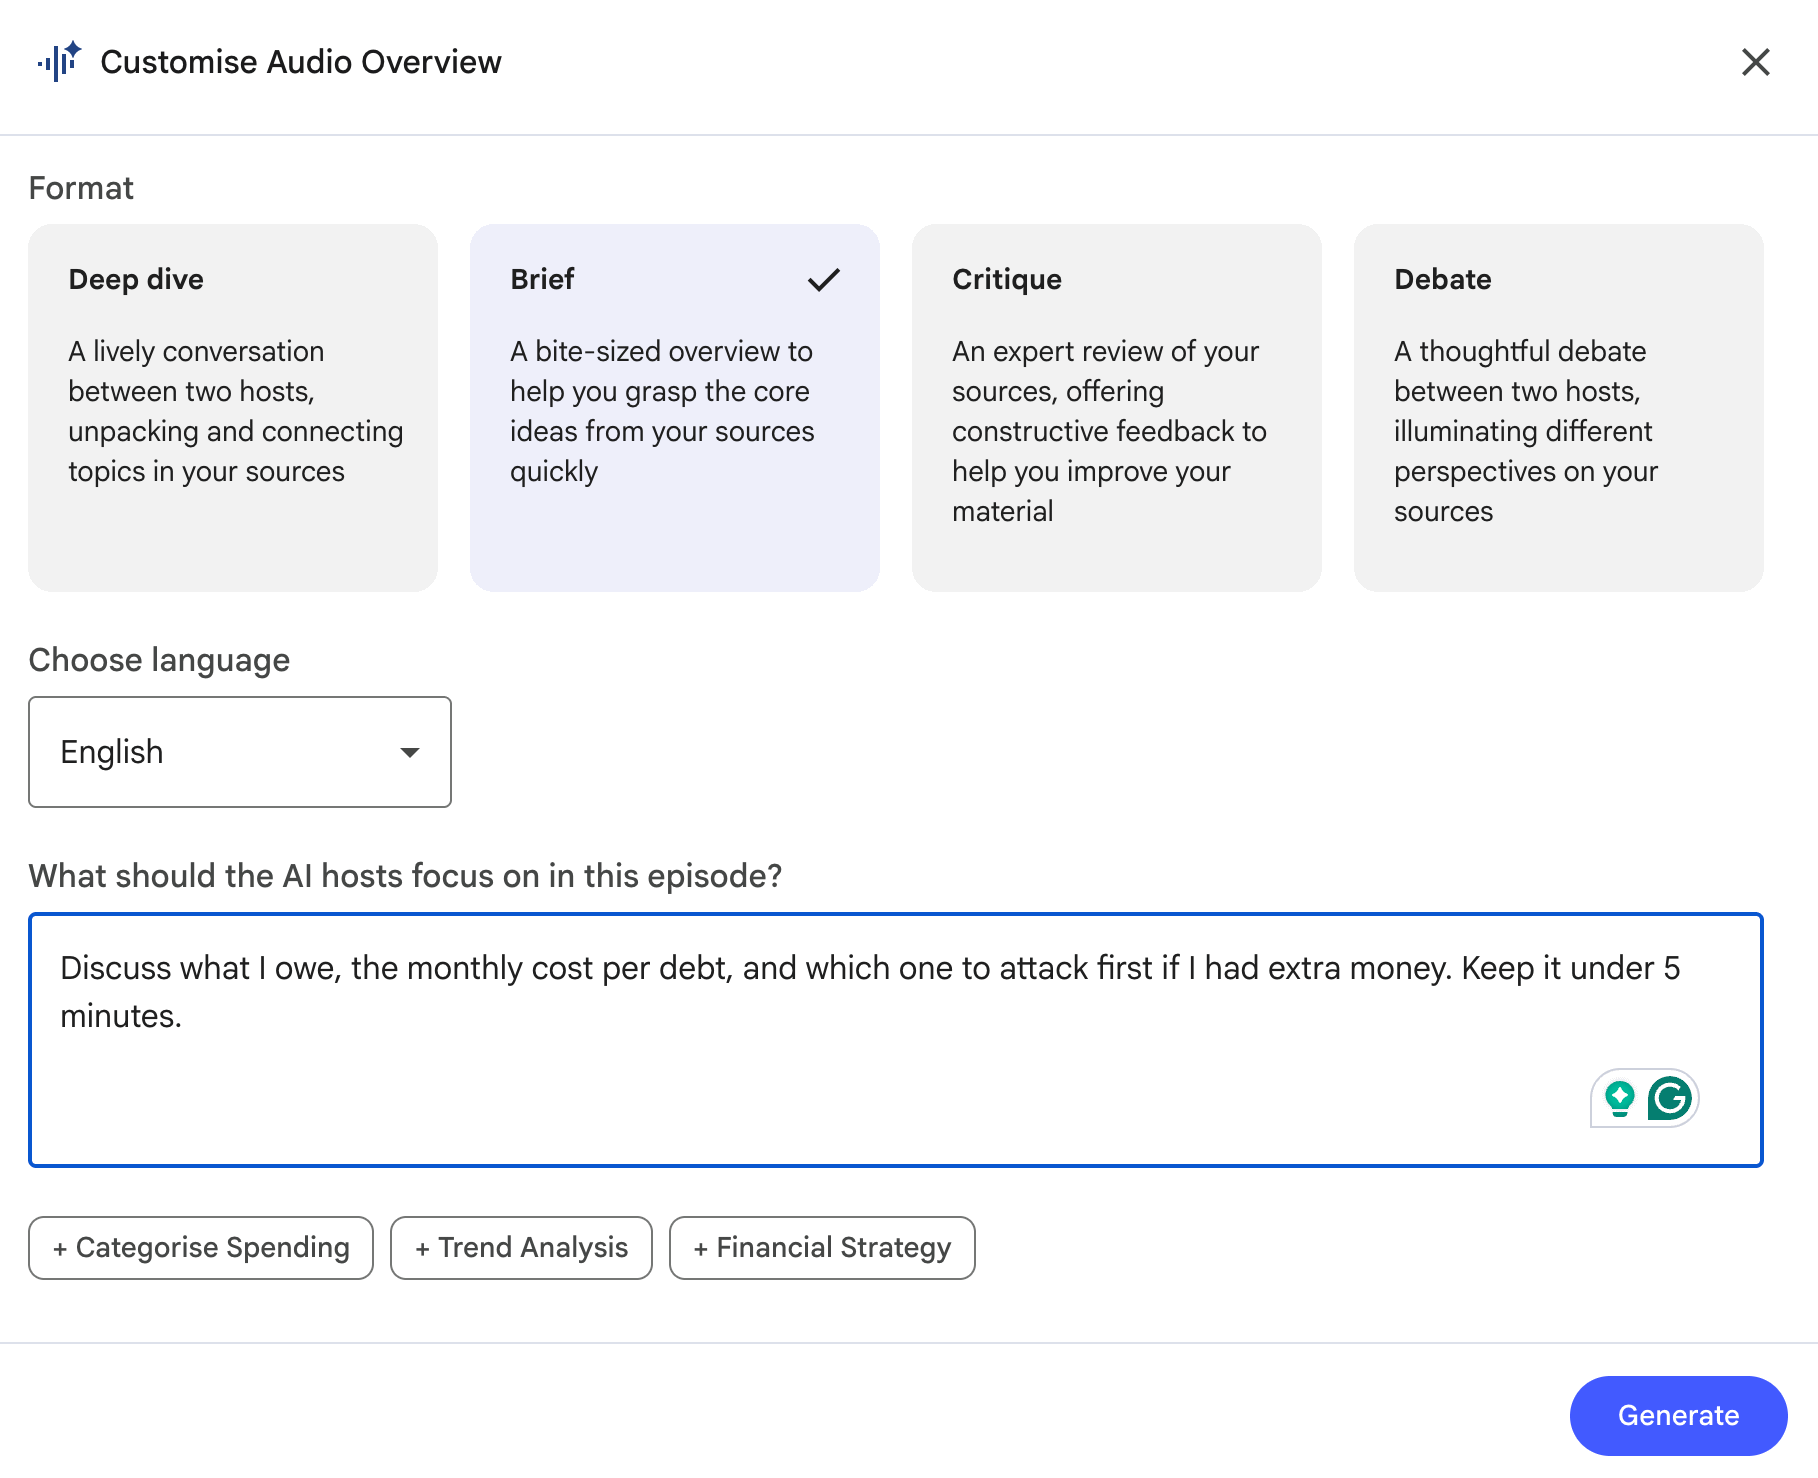
Here is the prompt I used.
Prompt:
Discuss what I owe, the monthly cost per debt, and which one to attack first if I had extra money. Keep it under 5 minutes.Output:
One audio file replaced three hours of avoidance.
Prompt 2: Where I'll Be in 12 Months
The dangerous part of money isn’t today.
It’s the version of today repeated 52 times.
So I asked NotebookLM to show me that.
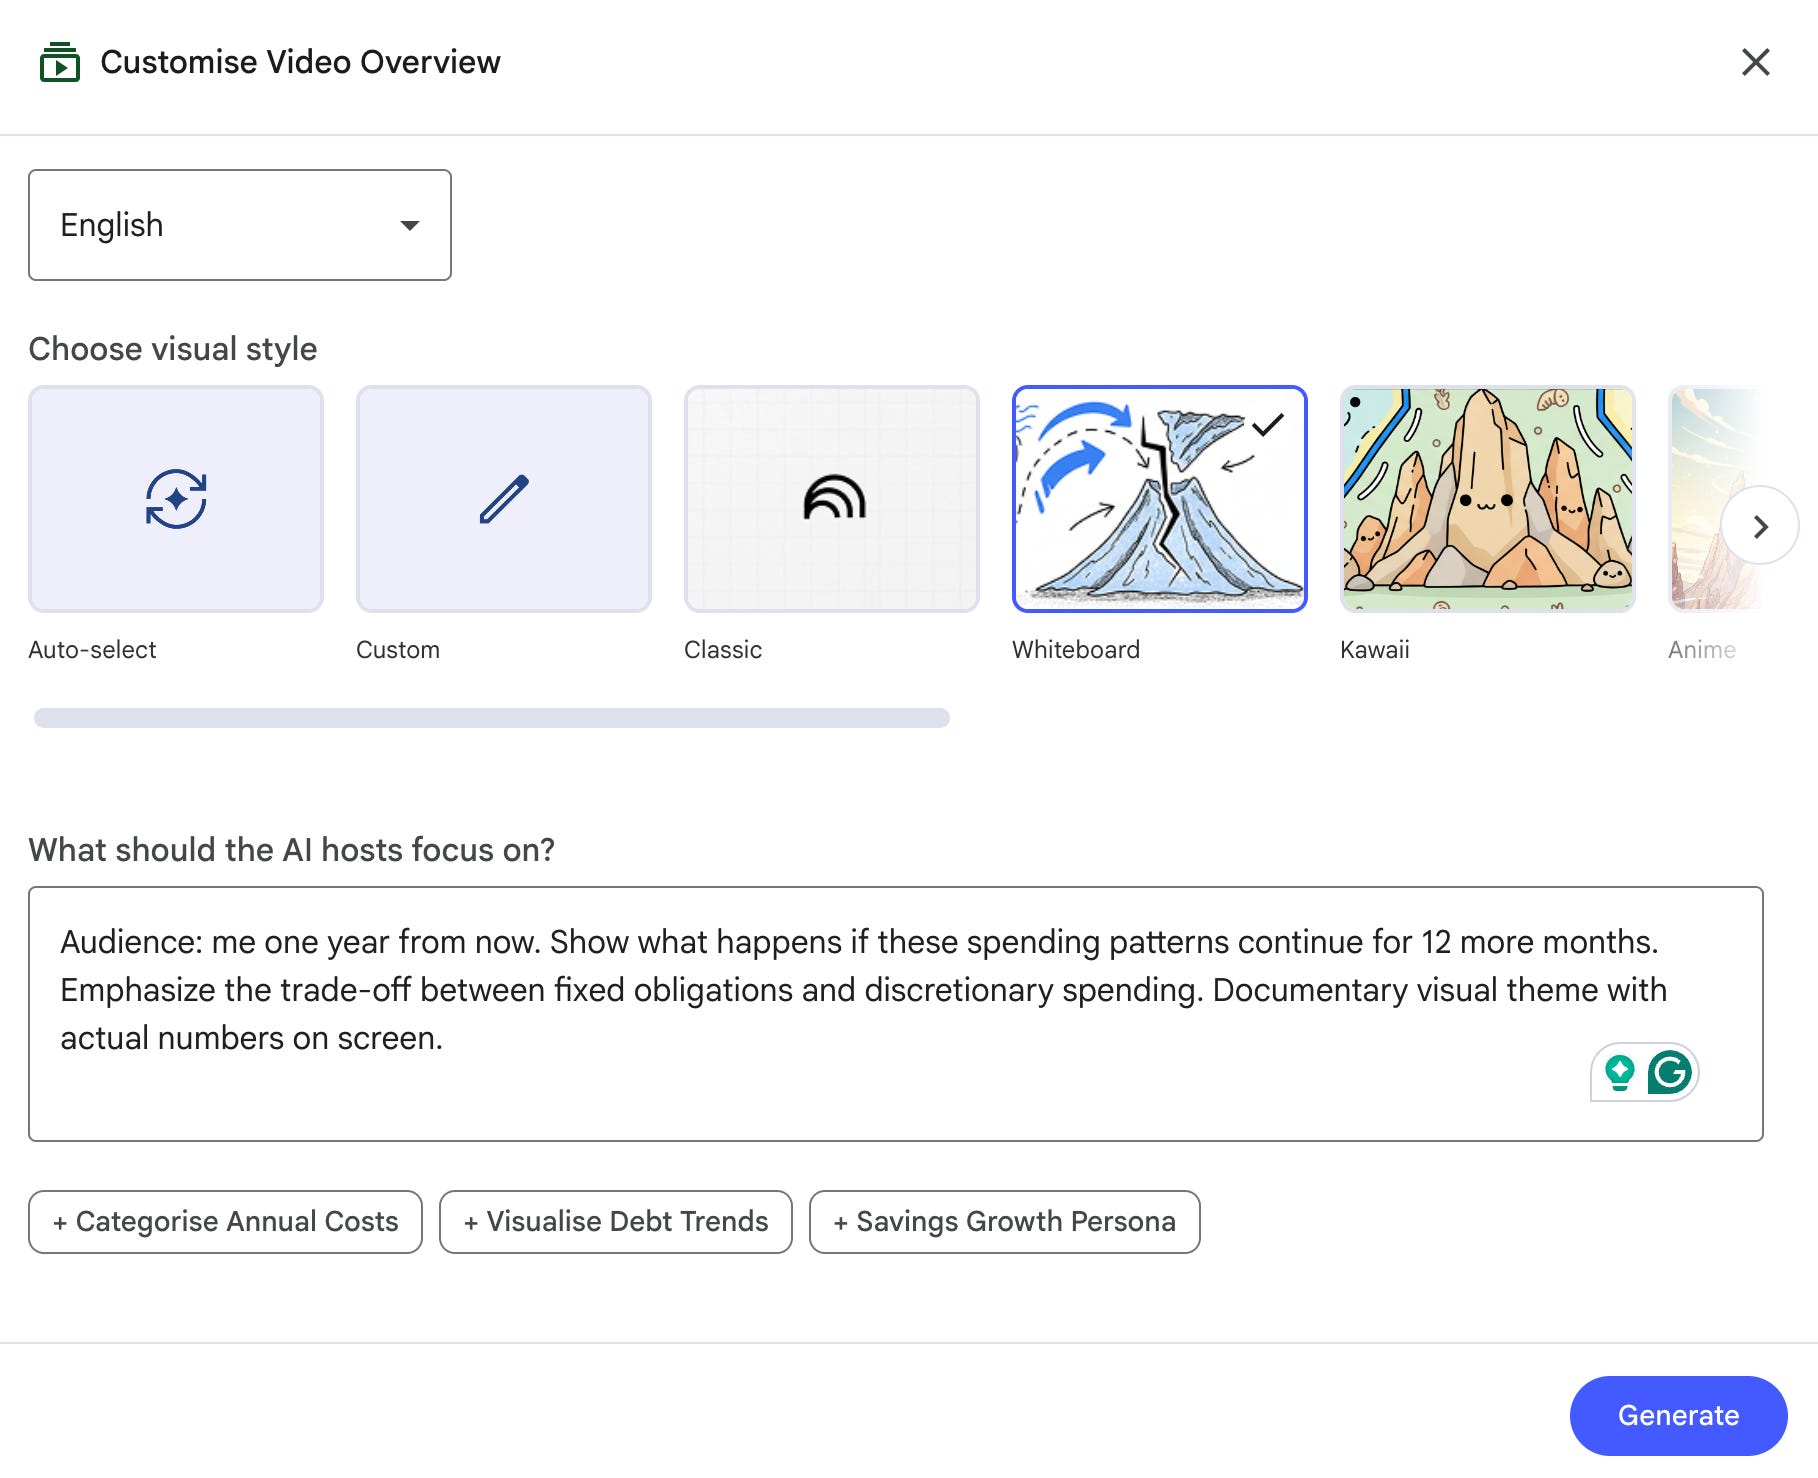
UI: Studio panel → Video Overview → Customize → paste prompt → Format: Explainer → Generate.
Here is the prompt I used.
Prompt:
Audience: me one year from now. Show what happens if these spending patterns continue for 12 more months. Emphasize the trade-off between fixed obligations and discretionary spending. Documentary visual theme with actual numbers on screen.Output:
The video showed numbers I’d been avoiding since January.
Prompt 3: Income vs Outflow Deck
I needed to present my own finances to myself. Not metaphorically. Actual slides.
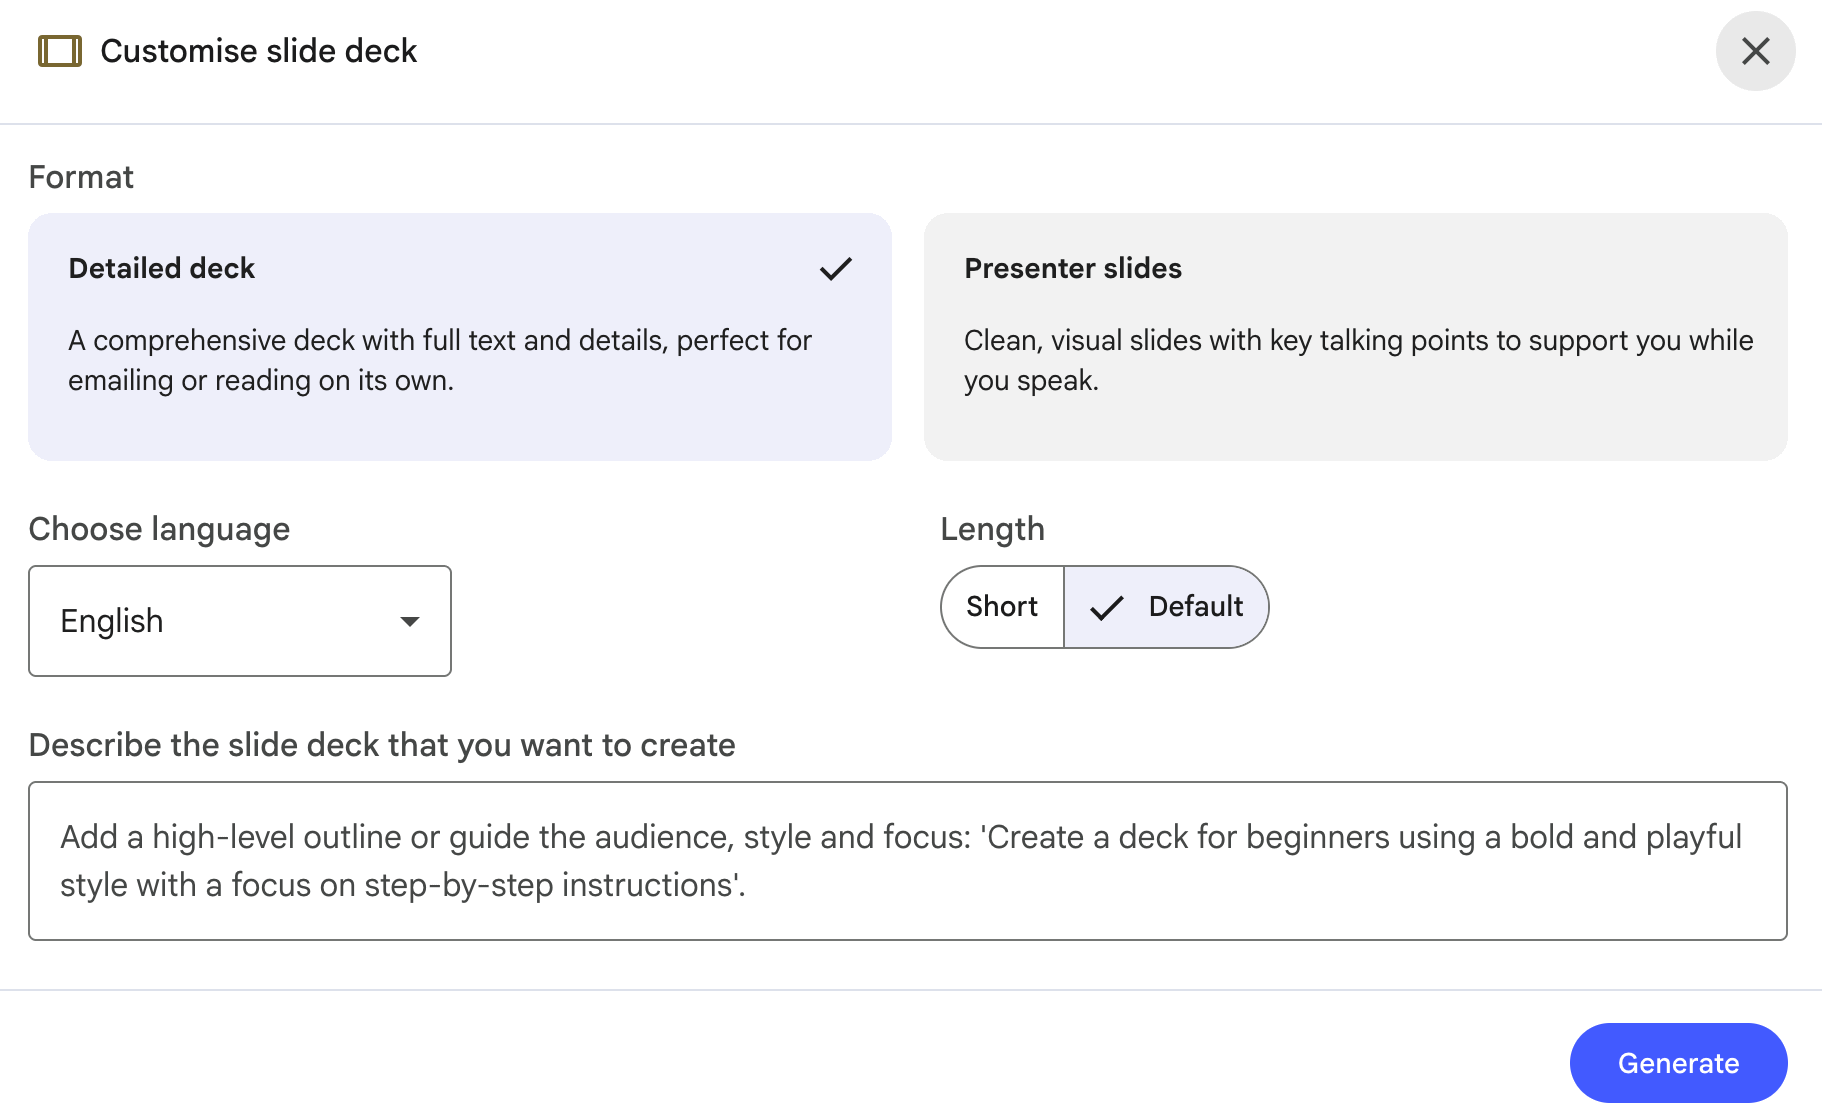
UI: Studio panel → Slide Deck → Customize → paste prompt → Length:
Short → Generate.
Here is the prompt.
Prompt:
One slide per metric: Income In, Money Out, Net Position, Debt Service.
Each slide: title, 3 bullets with raw numbers, speaker notes explaining the trend across the data period.
Output:
These slides told me what 16 months of Excel never did.
PS: You mostly can’t customize the number of slides, but you can still try. Sometimes, it generates the exact number of slides you want.
Prompt 4: Money at a Glance
Numbers in a table are hidden.
Numbers in a bento grid don’t.
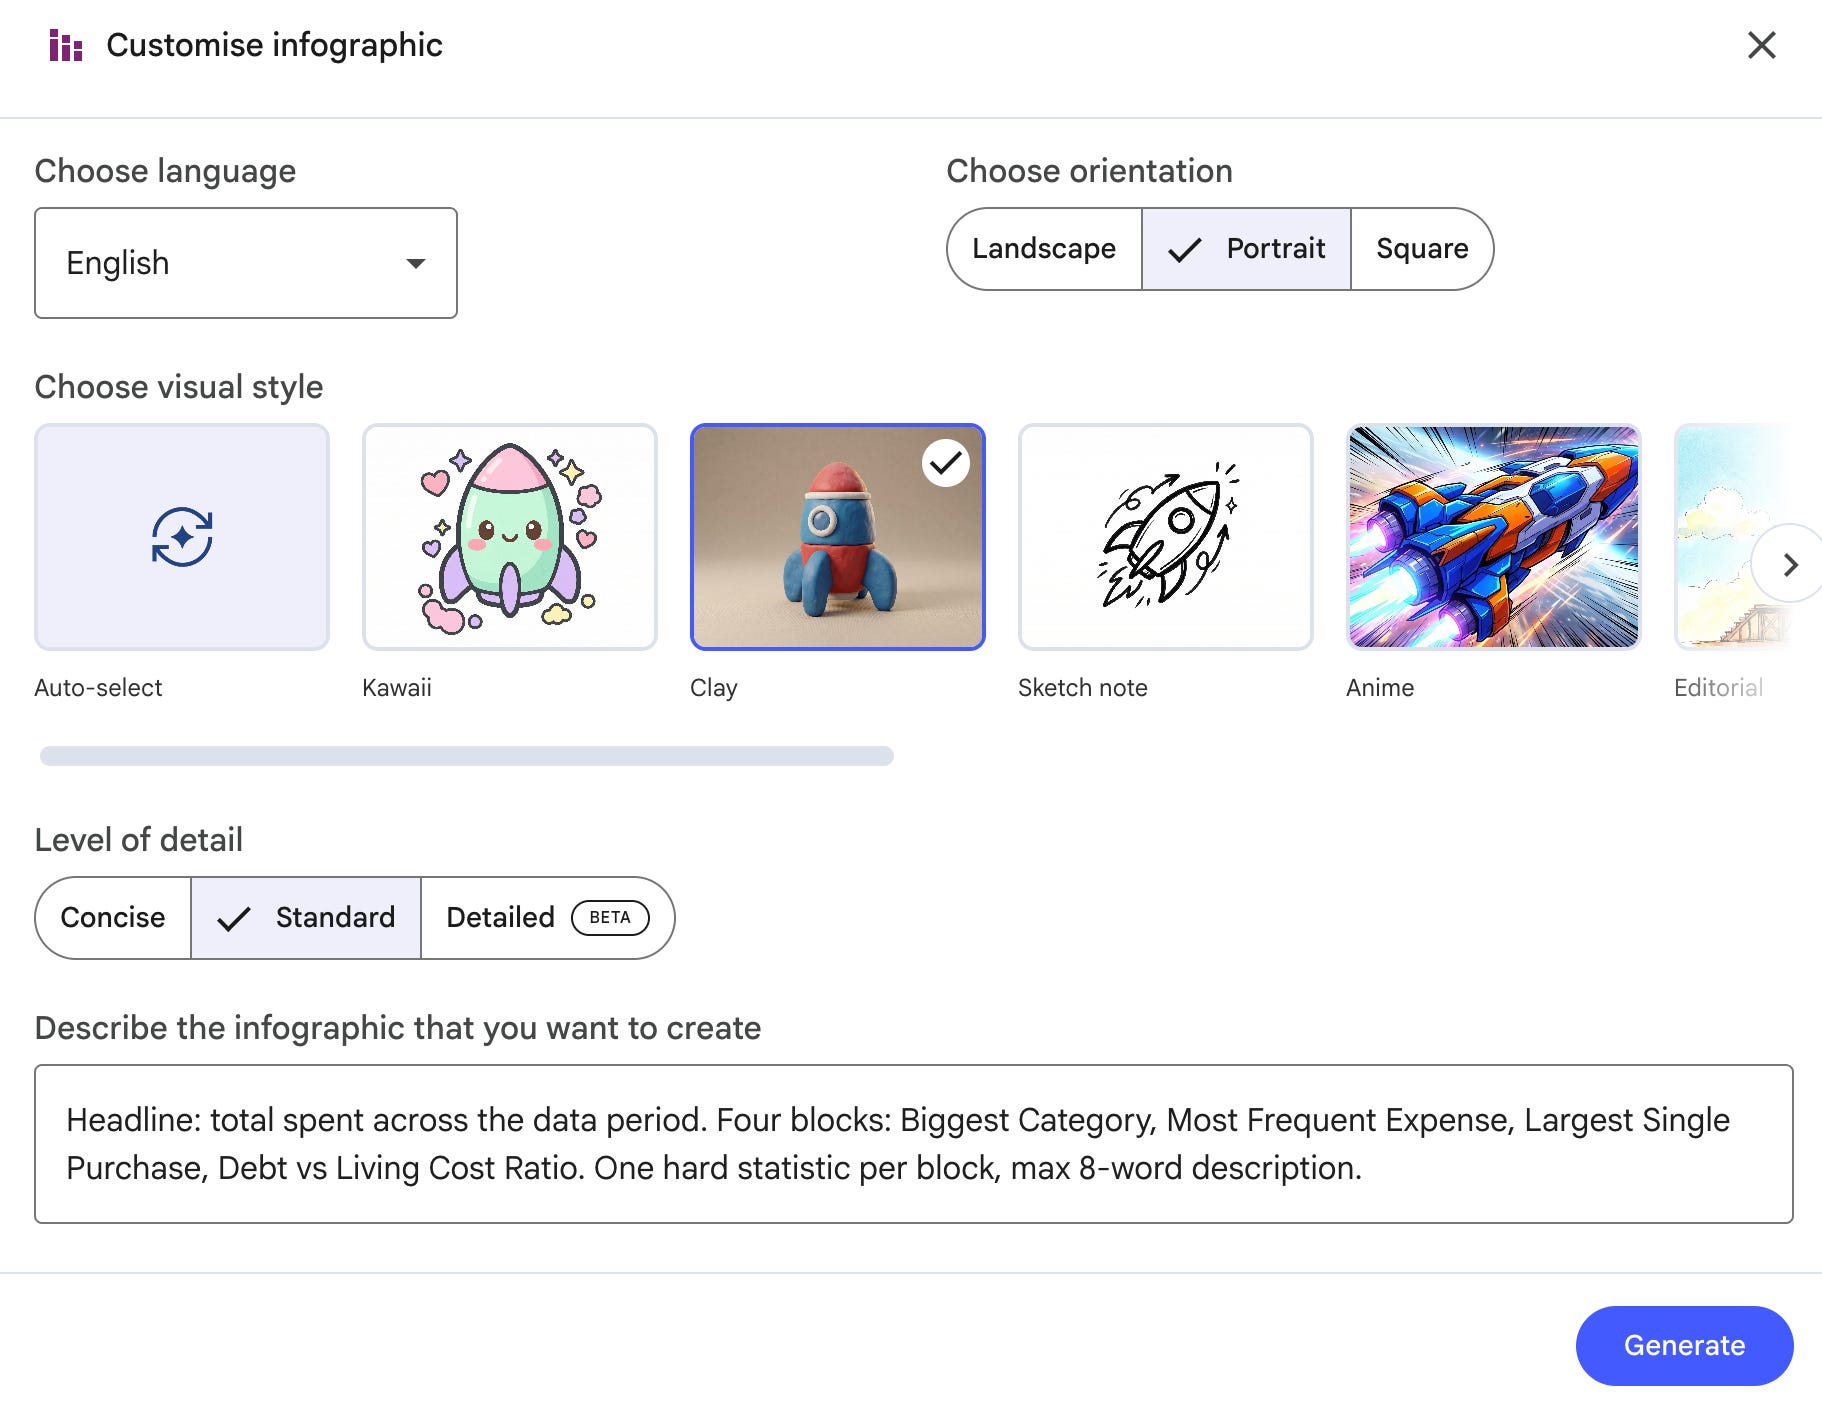
UI: Studio panel → Infographic → Customize → paste prompt → Visual Style: Clay Portrait → Generate.
Here is my prompt.
Prompt:
Headline: total spent across the data period. Four blocks: Biggest Category, Most Frequent Expense, Largest Single Purchase, Debt vs Living Cost Ratio. One hard statistic per block, max 8-word description.Output:
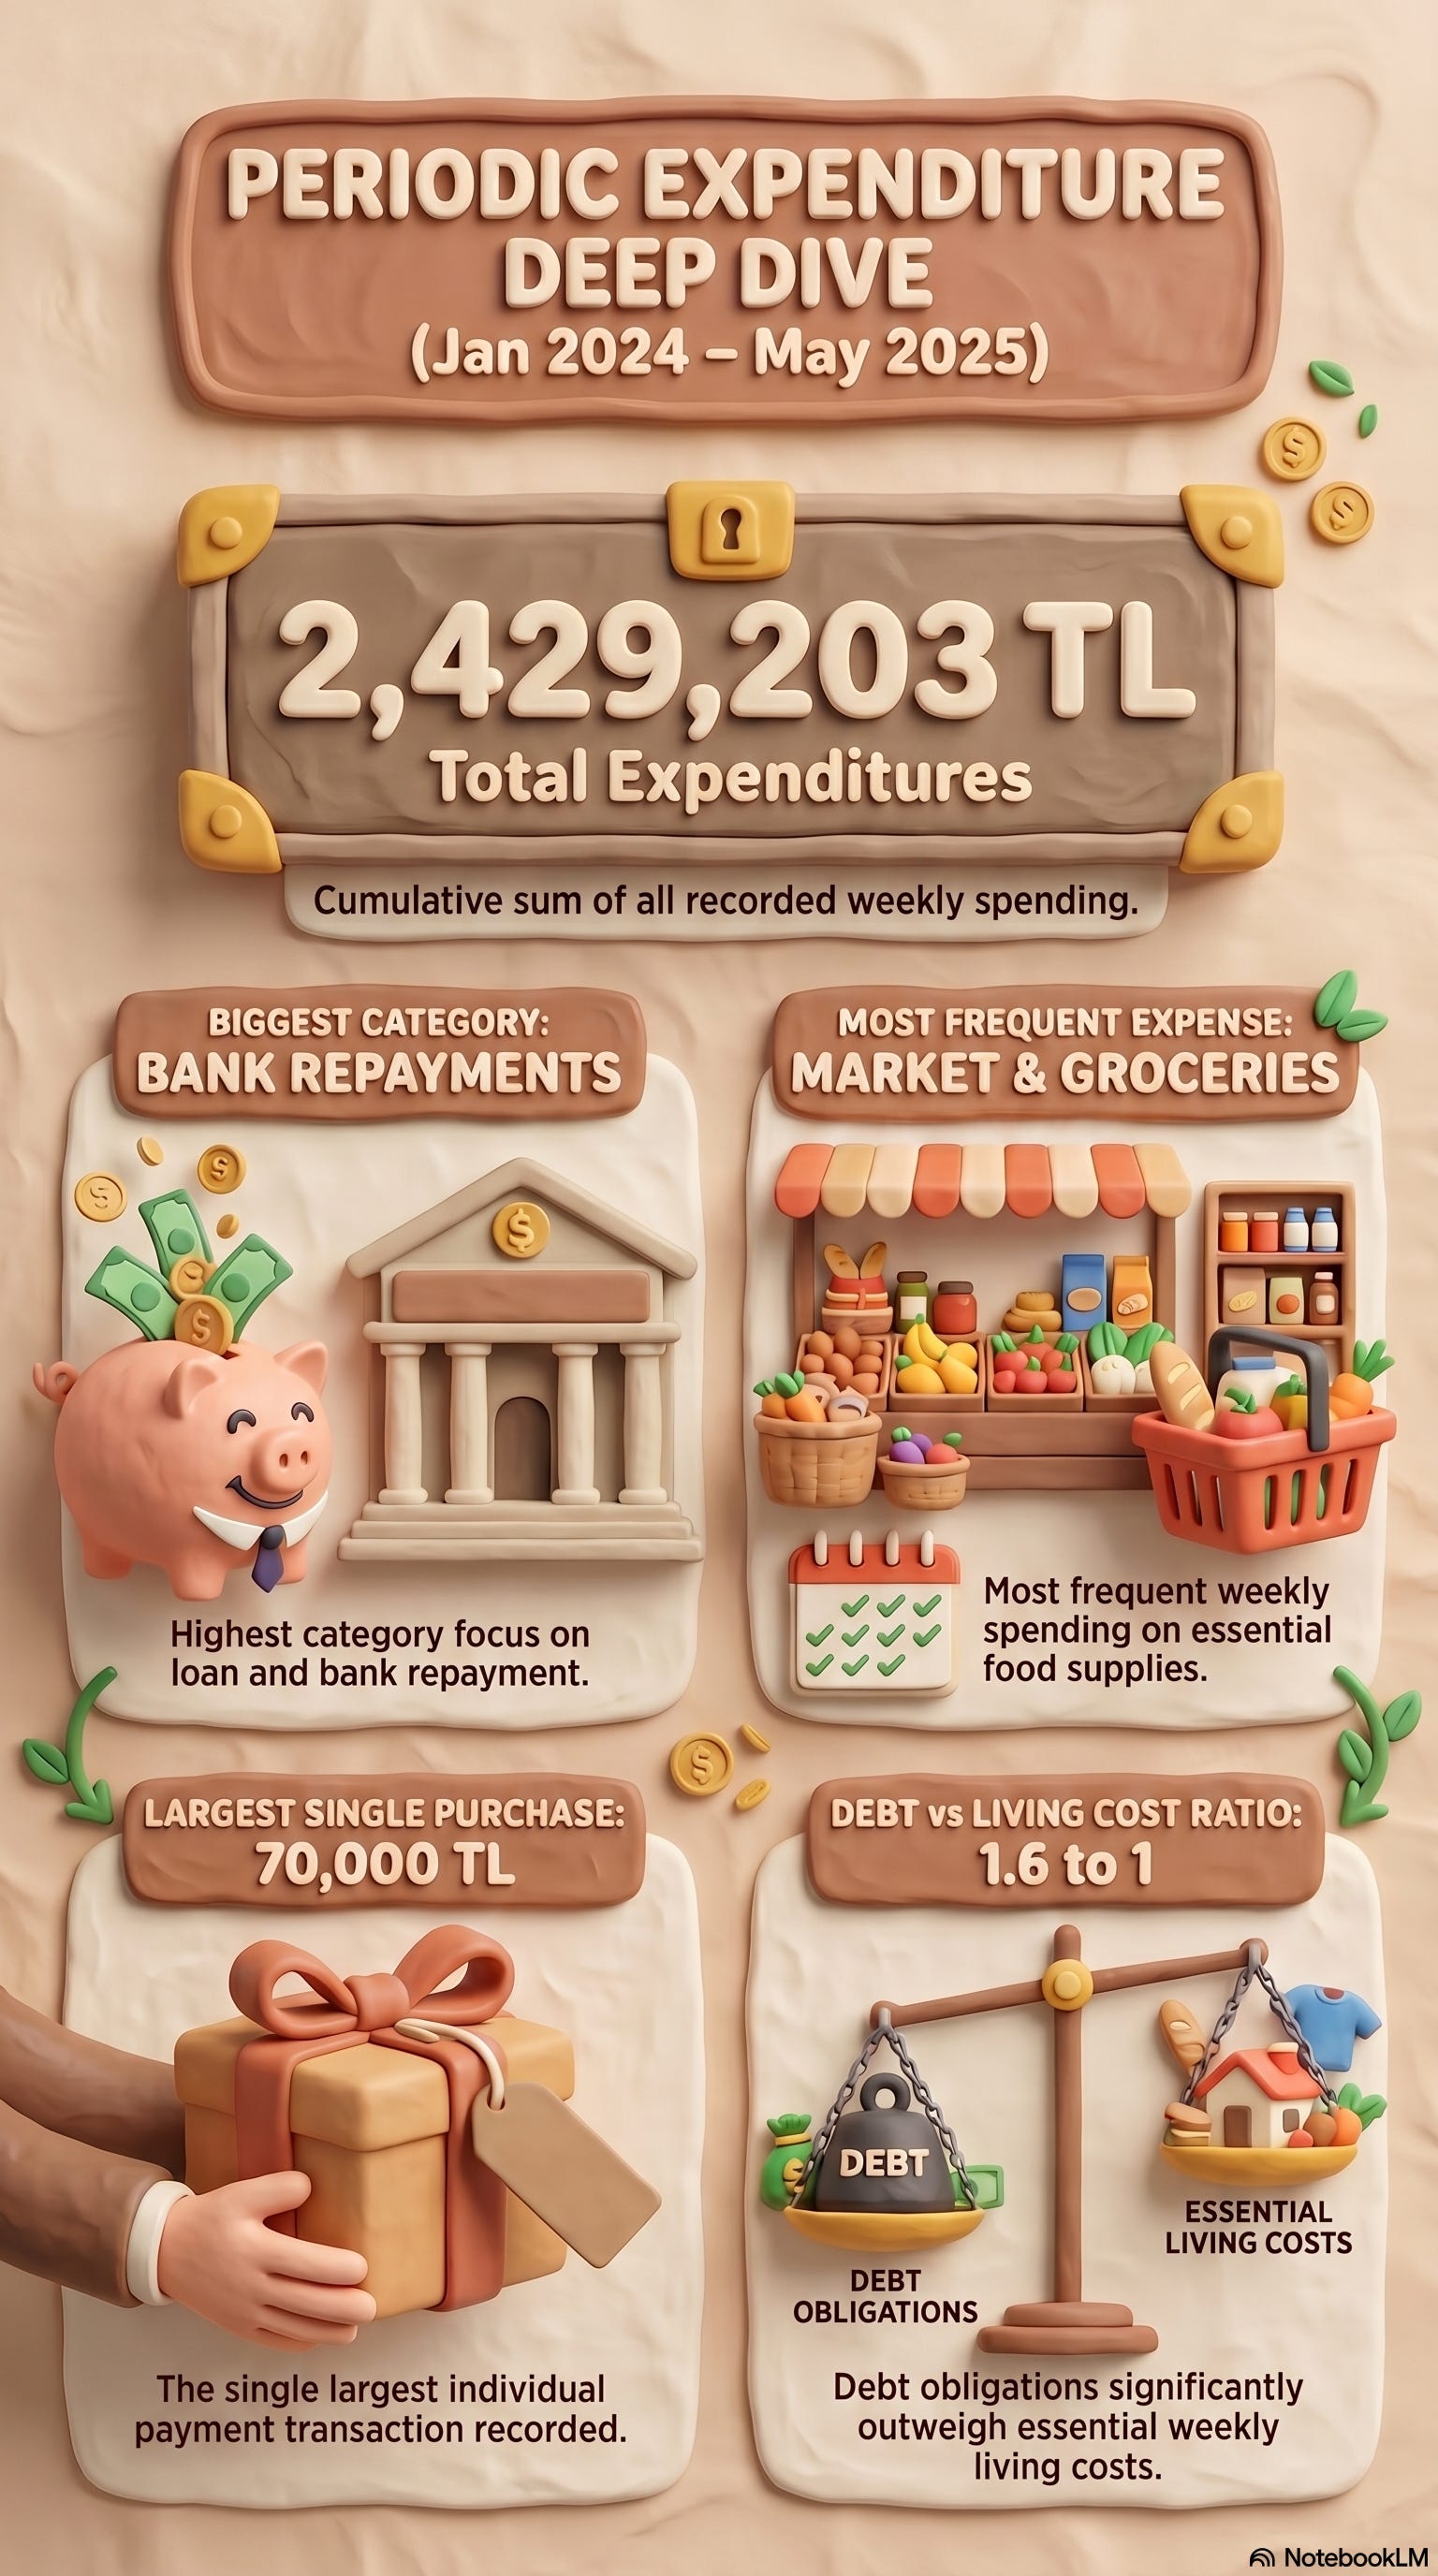
One funny image showed me exactly where my money goes.
Prompt 5: When Money Hits Hardest
Some months bleed more than others.
I wanted to see the pattern, not feel it.
UI: Studio panel → Infographic → Customize → paste prompt → Visual Style: Sketch note Grid → Orientation: Landscape → Generate.
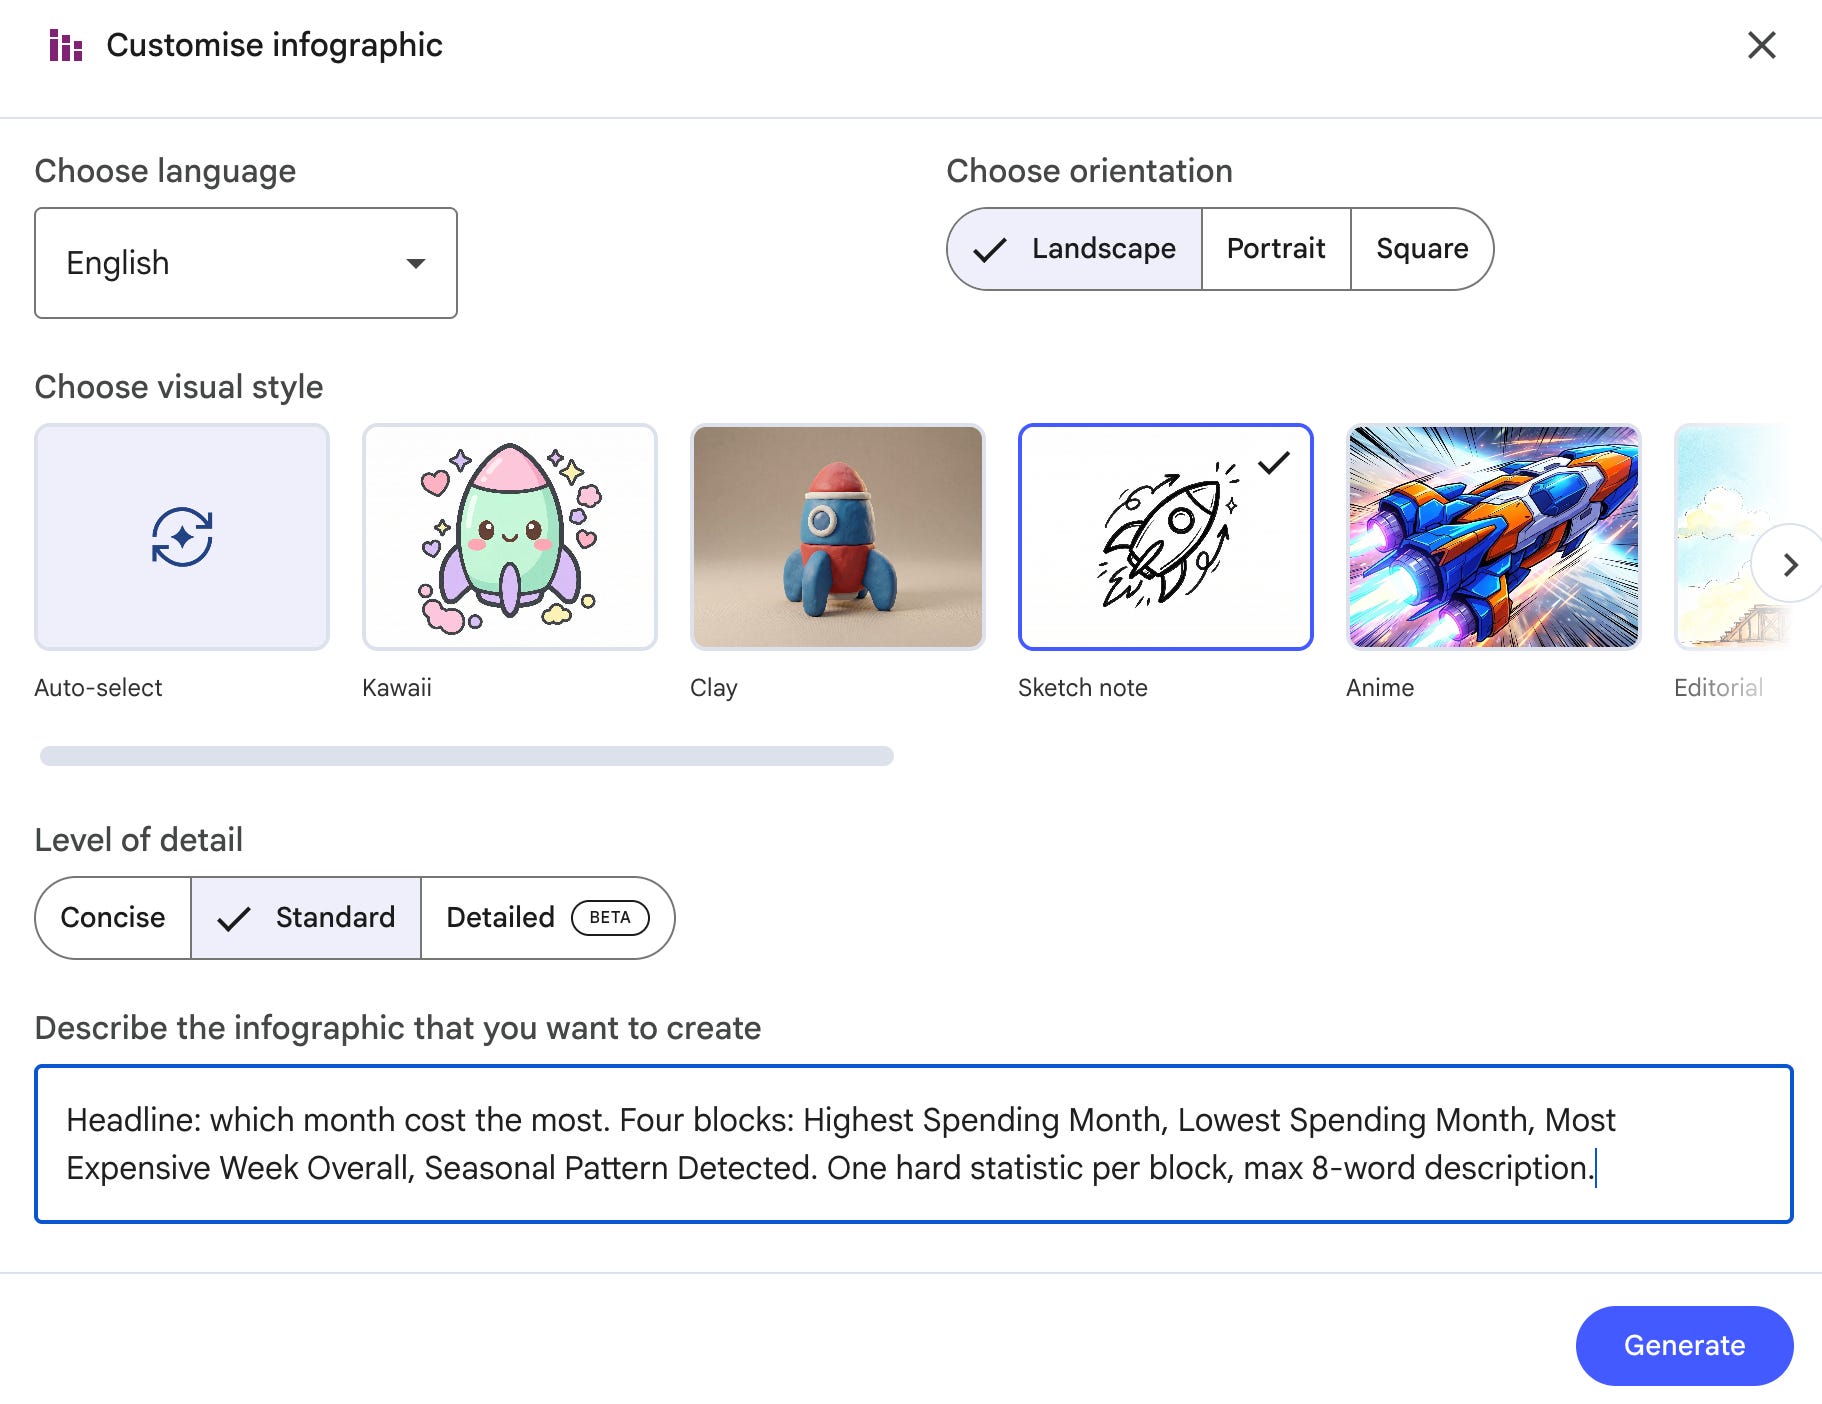
Here is the prompt.
Prompt:
Headline: which month cost the most. Four blocks: Highest Spending Month, Lowest Spending Month, Most Expensive Week Overall, Seasonal Pattern Detected. One hard statistic per block, max 8-word description.Output:
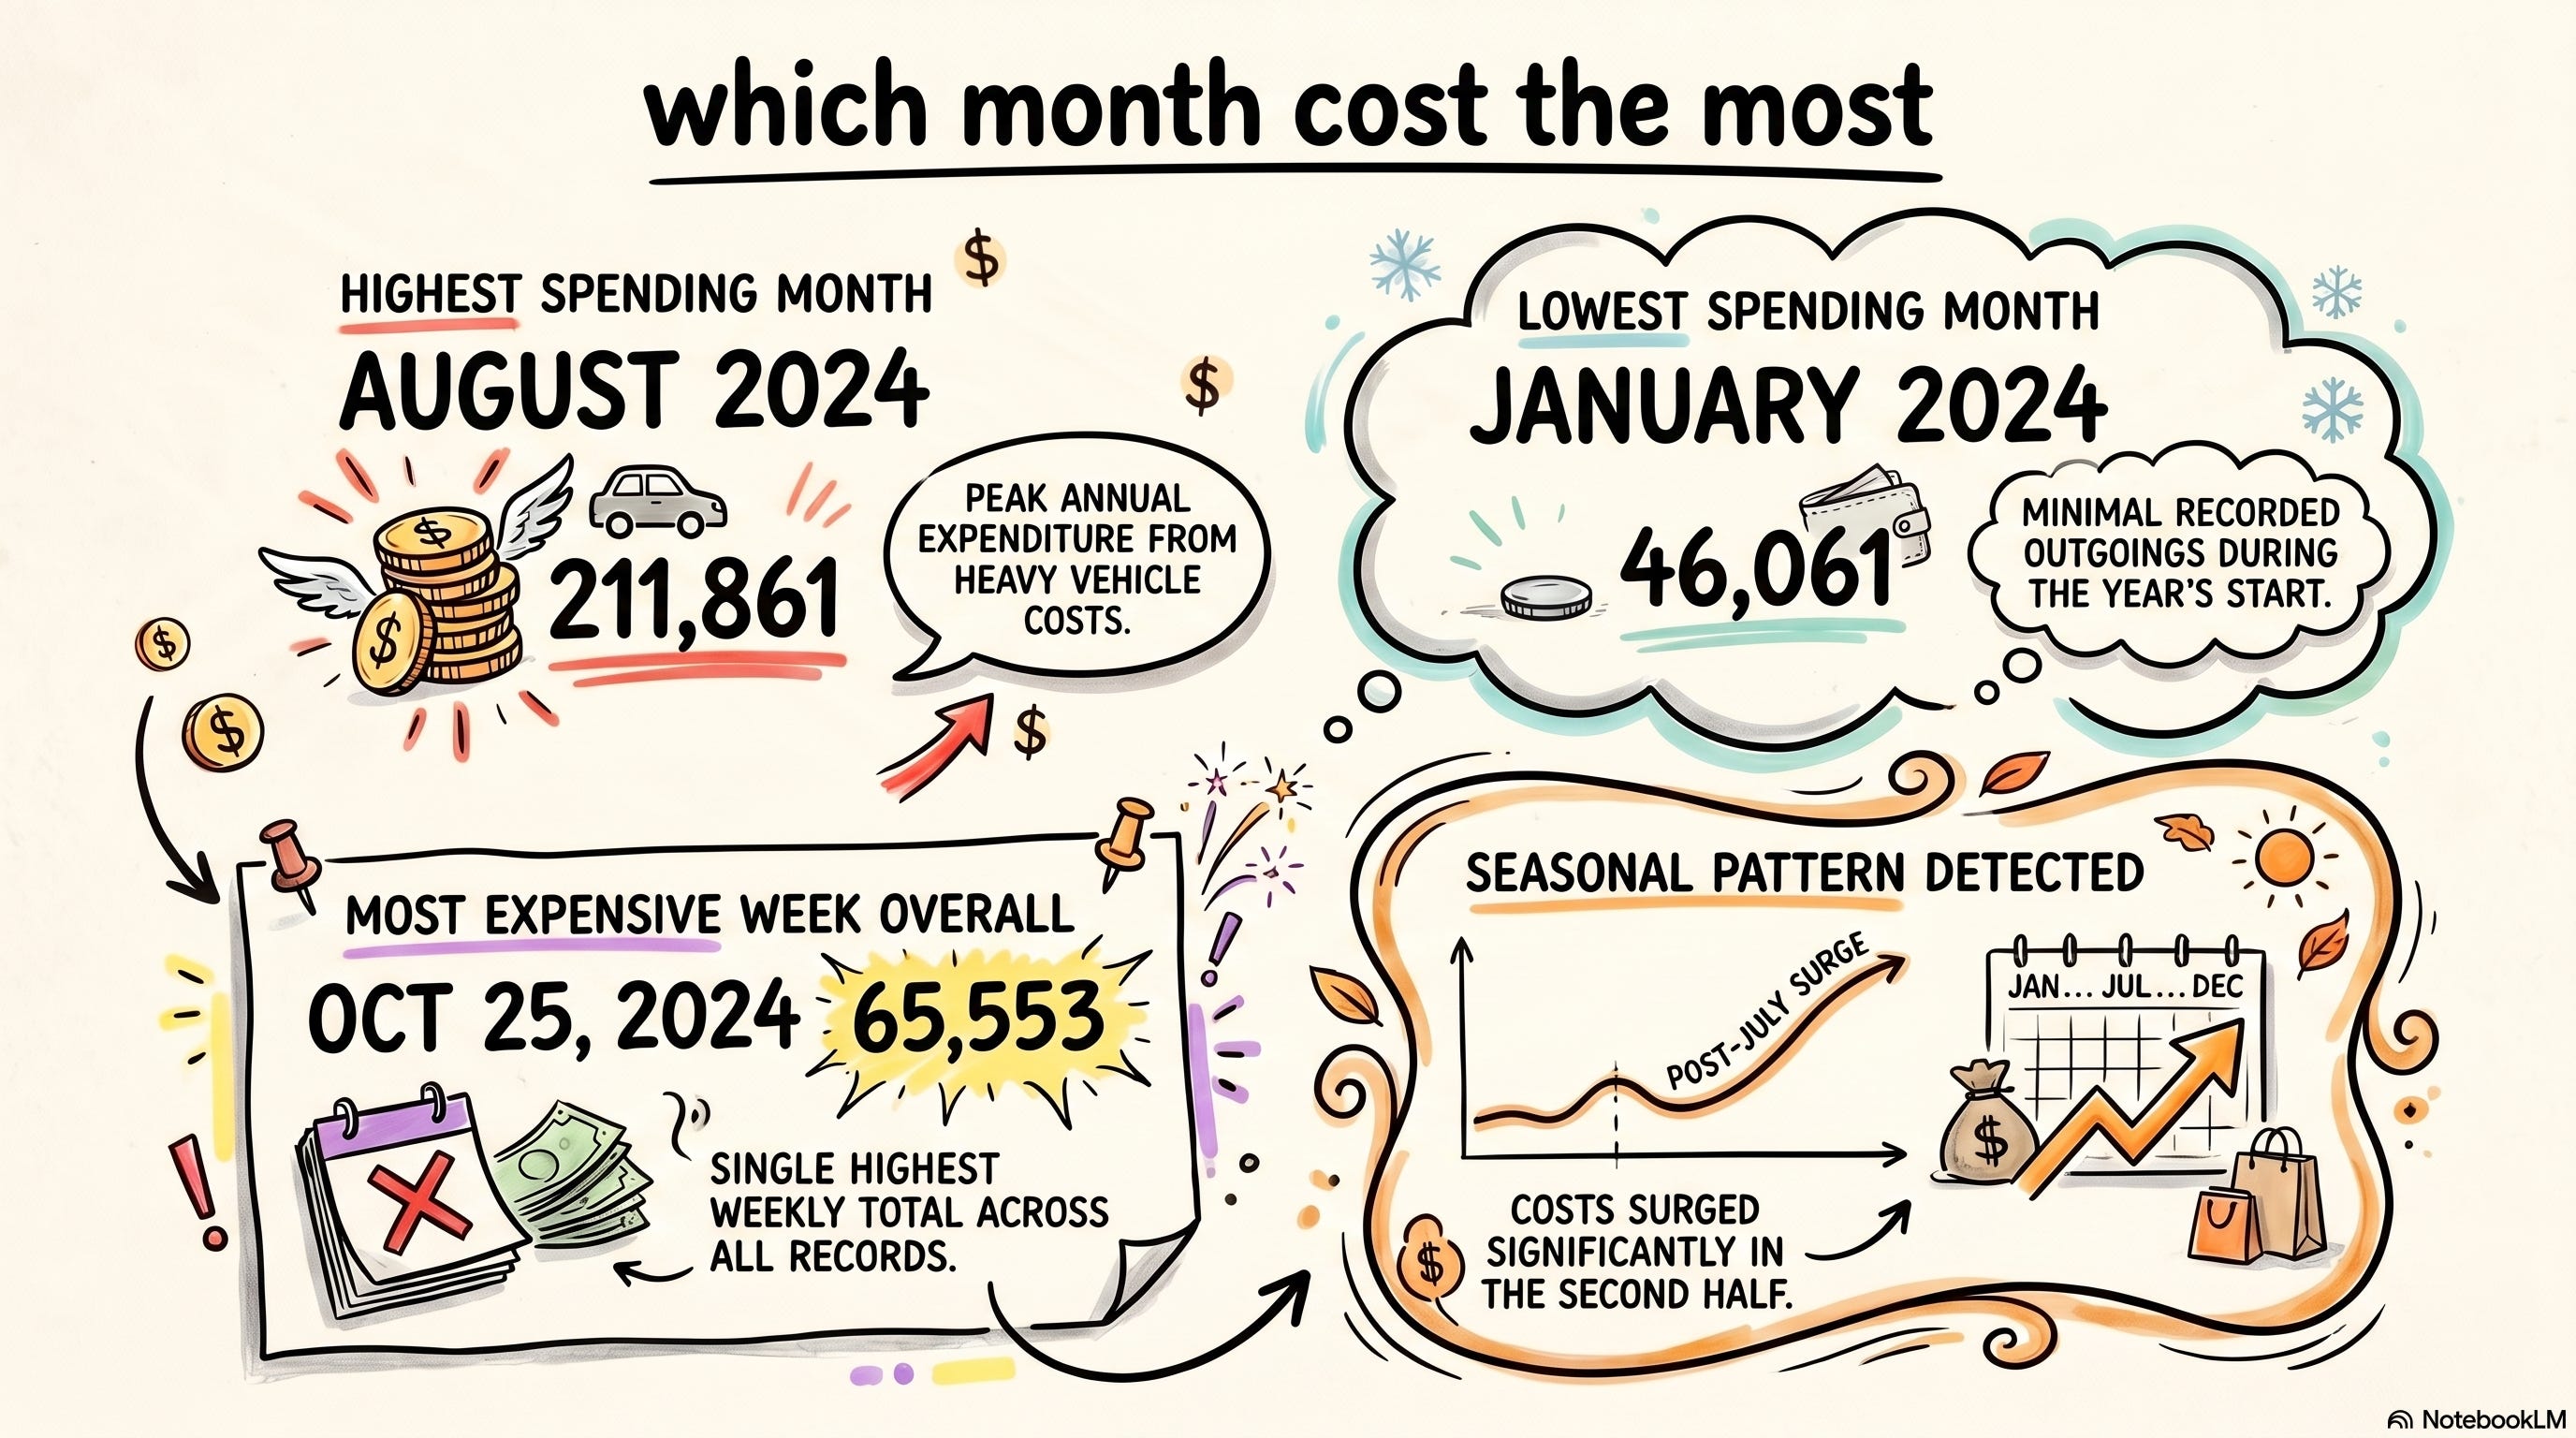
The seasonality I never noticed was sitting in plain sight.
Prompt 6: My Financial Map
Categories don’t live alone. Rent talks to utilities. Debt talks to everything.
UI: Studio panel → Mind Map → Customize → Generate
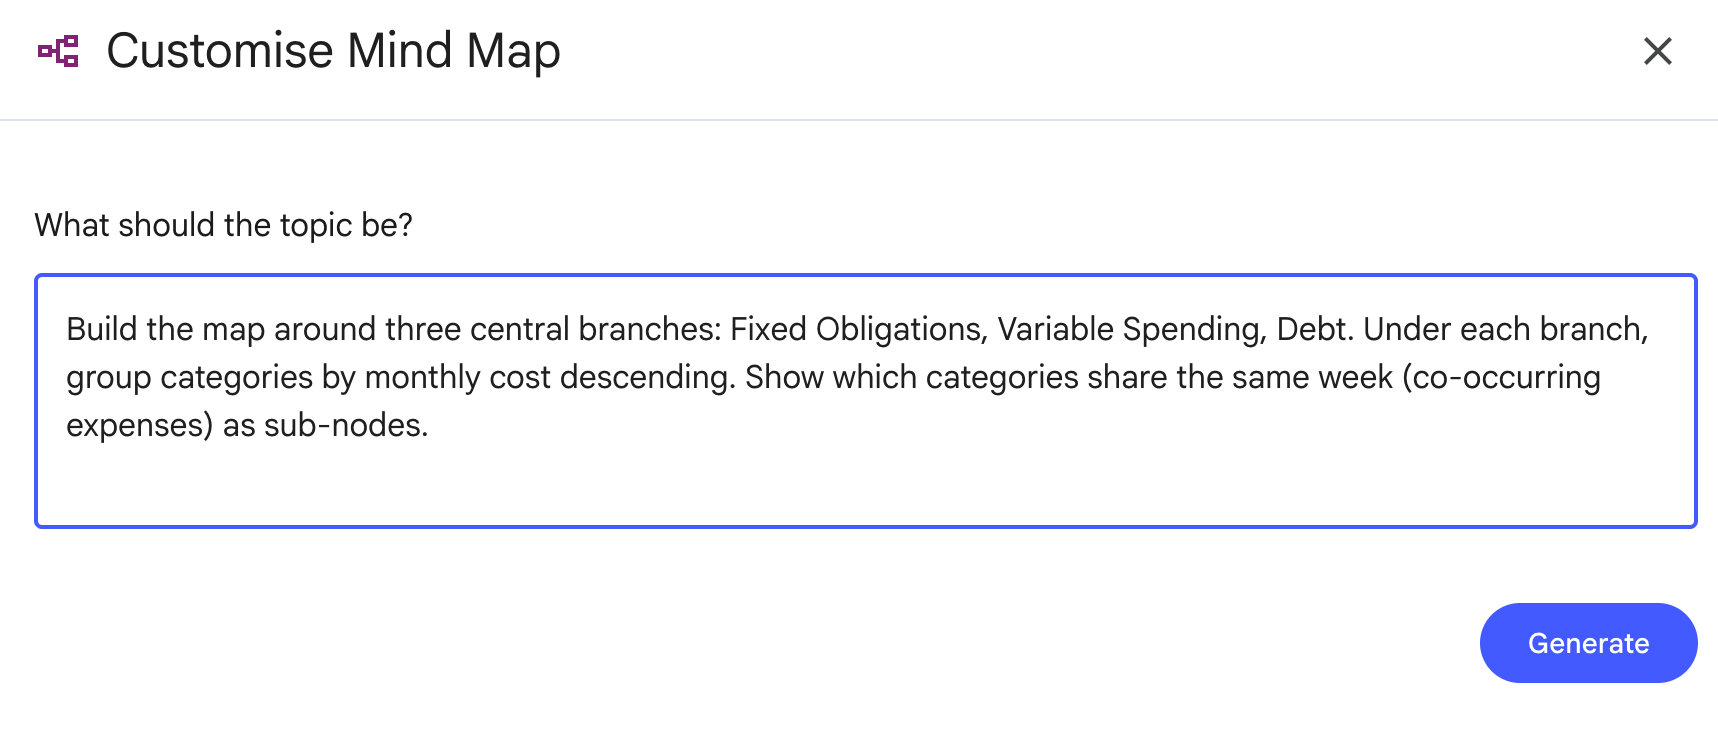
Here is the prompt.
Prompt:
Build the map around three central branches:
Fixed Obligations, Variable Spending, Debt. Under each branch, group categories by
monthly cost descending.
Show which categories share the same week (co-occurring expenses) as sub-nodes.
Output:
Seeing the relationships made the priorities obvious.
Prompt 7: What I’m Locked Into
Some money decisions were made months ago and still cost me every week. I wanted that list.
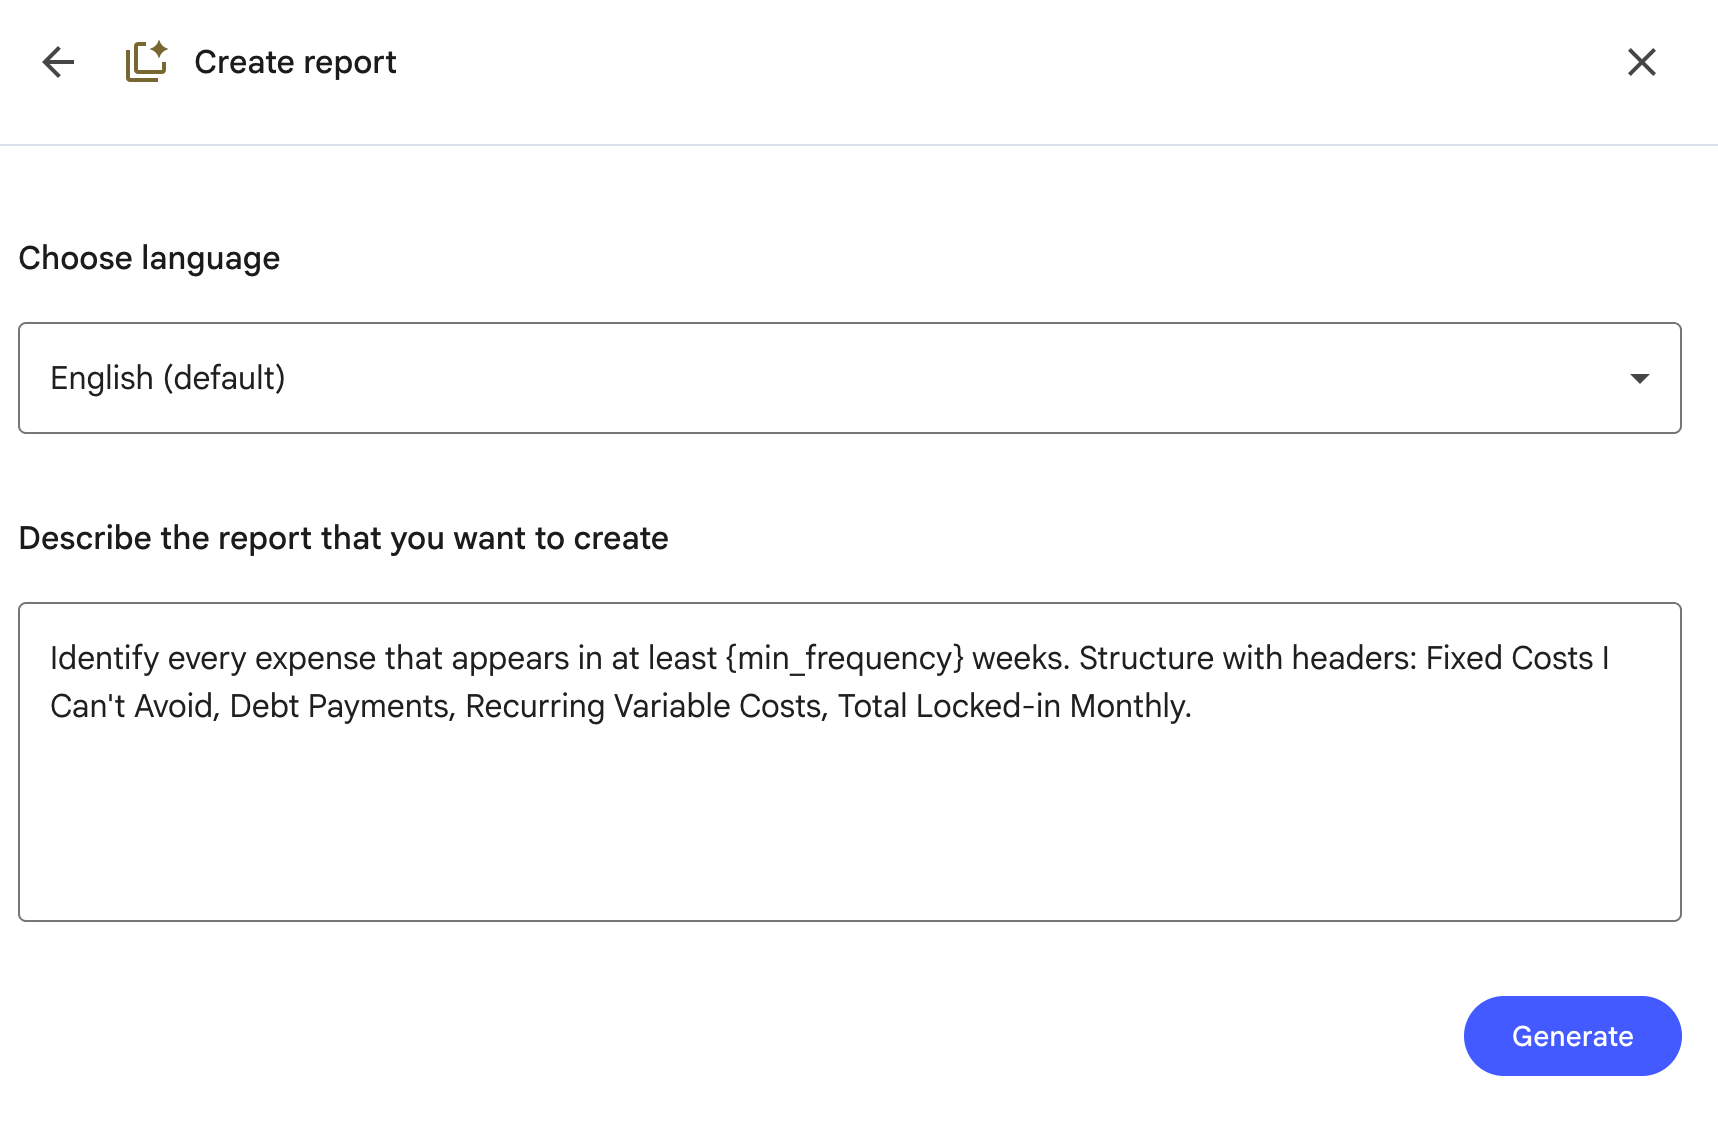
UI: Studio panel → Reports → Create your own → paste prompt → Generate.
Here is my prompt.
Prompt:
Identify every expense that appears in at least {min_frequency} weeks. Structure with headers: Fixed Costs I Can't Avoid, Debt Payments, Recurring Variable Costs, Total Locked-in Monthly.Replace {min_frequency} with 4 for monthly recurring, 8 for stricter.
Output:
Prompt 8: Where the Money Actually Leaks
Big purchases aren’t the problem. Small ones I forgot about are.
UI: Studio panel → Reports → Create your own → paste prompt → Generate.
Prompt:
Structure: Top 3 Silent Leaks (charges I'd forget without this data), Categories Growing Quarter Over Quarter, Single Biggest Avoidable Expense, Total Leak Estimate Annualized.Output:
The leak total was a flight ticket I’d been throwing away every year.
Prompt 9: The Cut List
If I had to cut one thing, which one saves the most? I didn’t want opinions. I wanted a ranked list from the data.
UI: Studio panel → Reports → Create your own → paste prompt → Generate. (Report format gives a ranked list grounded in sources; raw Data Table won’t rank by default.)
Here is the prompt.
Prompt:
Build a ranked cut list. Columns: Category, Weekly Average, Annual Cost, Necessity (Essential/Optional/Debt), Cut Recommendation (Keep/Reduce/Eliminate). Rank by annual cost descending. Output as a Markdown table.Output:
The top three would buy me 4 months of runway.
Prompt 10: Did I Spend More This Month
The only honest answer to “am I getting better” is two numbers side by side.
UI: Studio panel → Reports → Create your own → paste prompt → Generate.
Here is the prompt.
Prompt:
Compare {month_a} vs {month_b}. Output a Markdown table. Columns: Category, {month_a}, {month_b}, Change (₺), Change (%). Sort by absolute change descending. Missing categories: use 0.Replace {month_a} and {month_b} With the two months you want to compare.
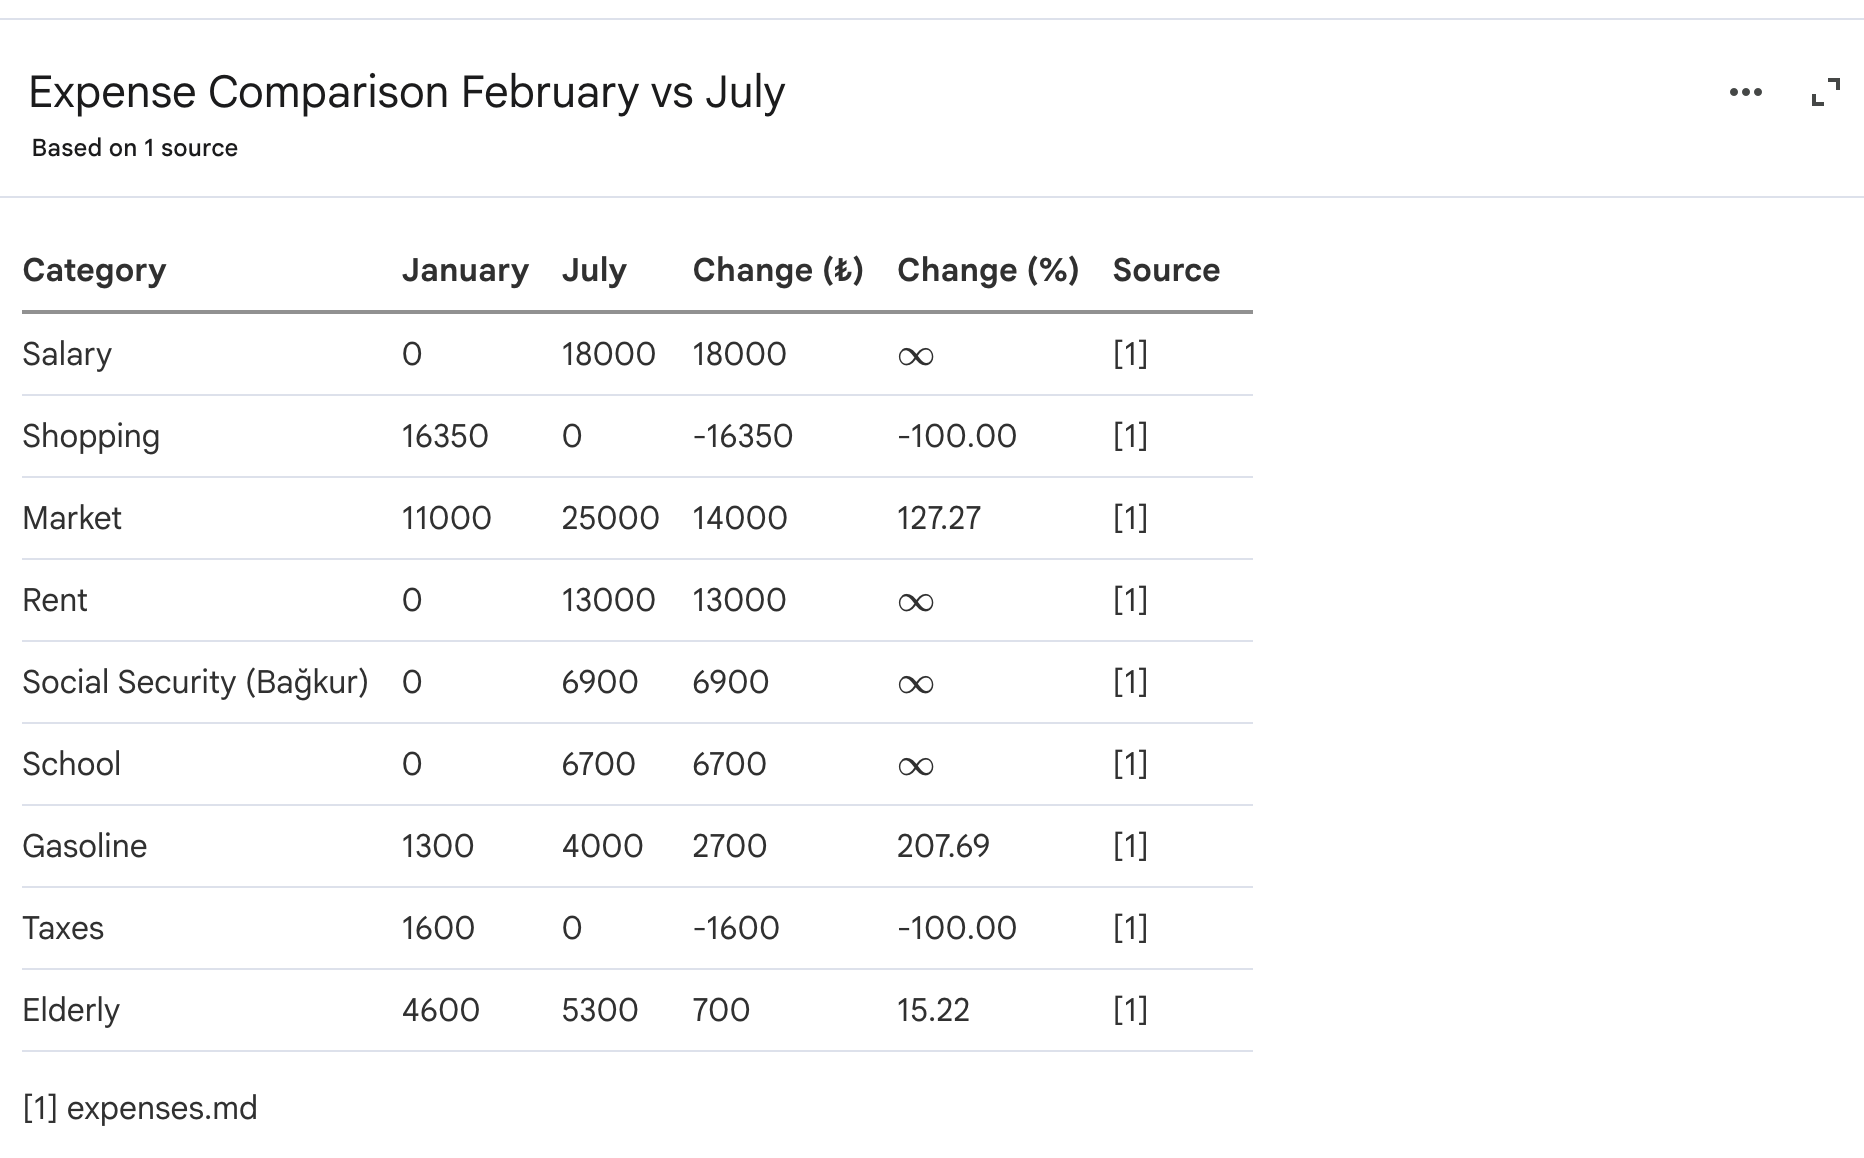
Here is the comparison between February and July.
Next Steps
If you ran even three of these prompts on your own data, you already know more about your money than most people do about theirs.
The rest of the NotebookLM rabbit hole is worth the trip.
Start with the foundation guide if you want to use NotebookLM for more than expenses. It’s the post that taught me everything I used here.
From there, 10 NotebookLM prompts that save 10 hours a week covers the time side of the same equation. Same setup, different sources, ten hours a week back.
If you want to build instead of analyze, the apps guide shows how to turn NotebookLM into a working tool, not just a reader.
And NotebookLM now living inside Gemini covers the new integration.
Three apps in ten minutes, zero code.
The one I keep coming back to is 10 NotebookLM Prompts That Put You Ahead of 99% of People.
It’s the direct sibling to this post.
Same prompt-engineering style, different domain.
Pick one.
Run it today.
What is that symbol you used in the last example? I’m assuming it’s a money value which in America I don’t recognize.
Yes notebook suppose to be private but still it is not good enough data protection,especially for financial solutions. It's a no from me but I am speaking from my hard earned experience in Europe.i would never recommend this approach to my client selling equity as one example.