
Data Visualization GPT’s: Wish I Knew Before (As a Beginner)
Unlock Data Insights: Beginner’s Guide to Visualization GPTs


In 2024, over 2.5 quintillion bytes of data are created daily, a staggering figure highlighting the critical importance of effectively visualizing and interpreting this vast ocean of information.
This statistic underscores a pivotal shift in data science, where visualization has evolved from a supplementary skill to a fundamental necessity.
Today, we’ll go into the essential knowledge and strategies I wish I had known before delving into the world of Data Visualization GPTs, shedding light on transforming overwhelming data into actionable insights.
Life Longevity Factors
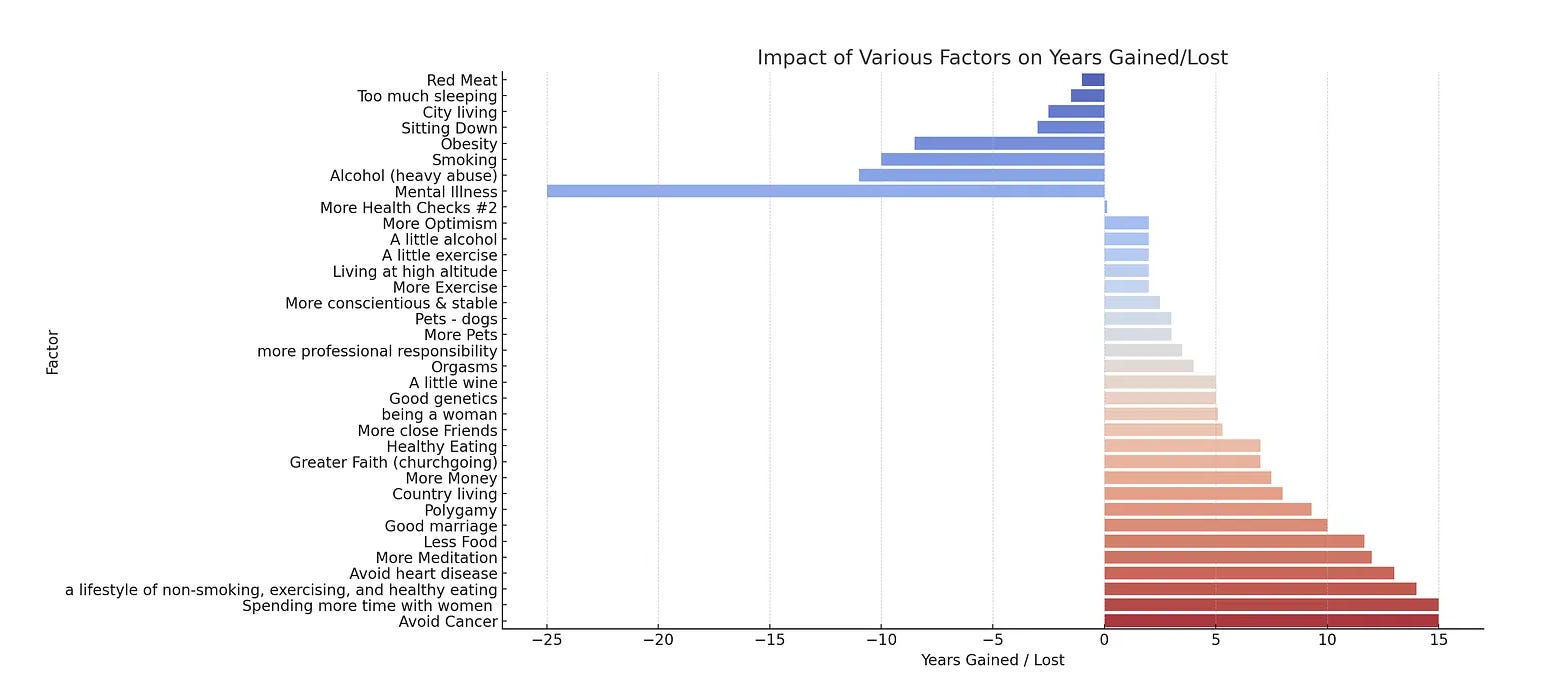
Here is the data we will use to test the first two GPTs.
Let’s see this data a little bit.
df.head()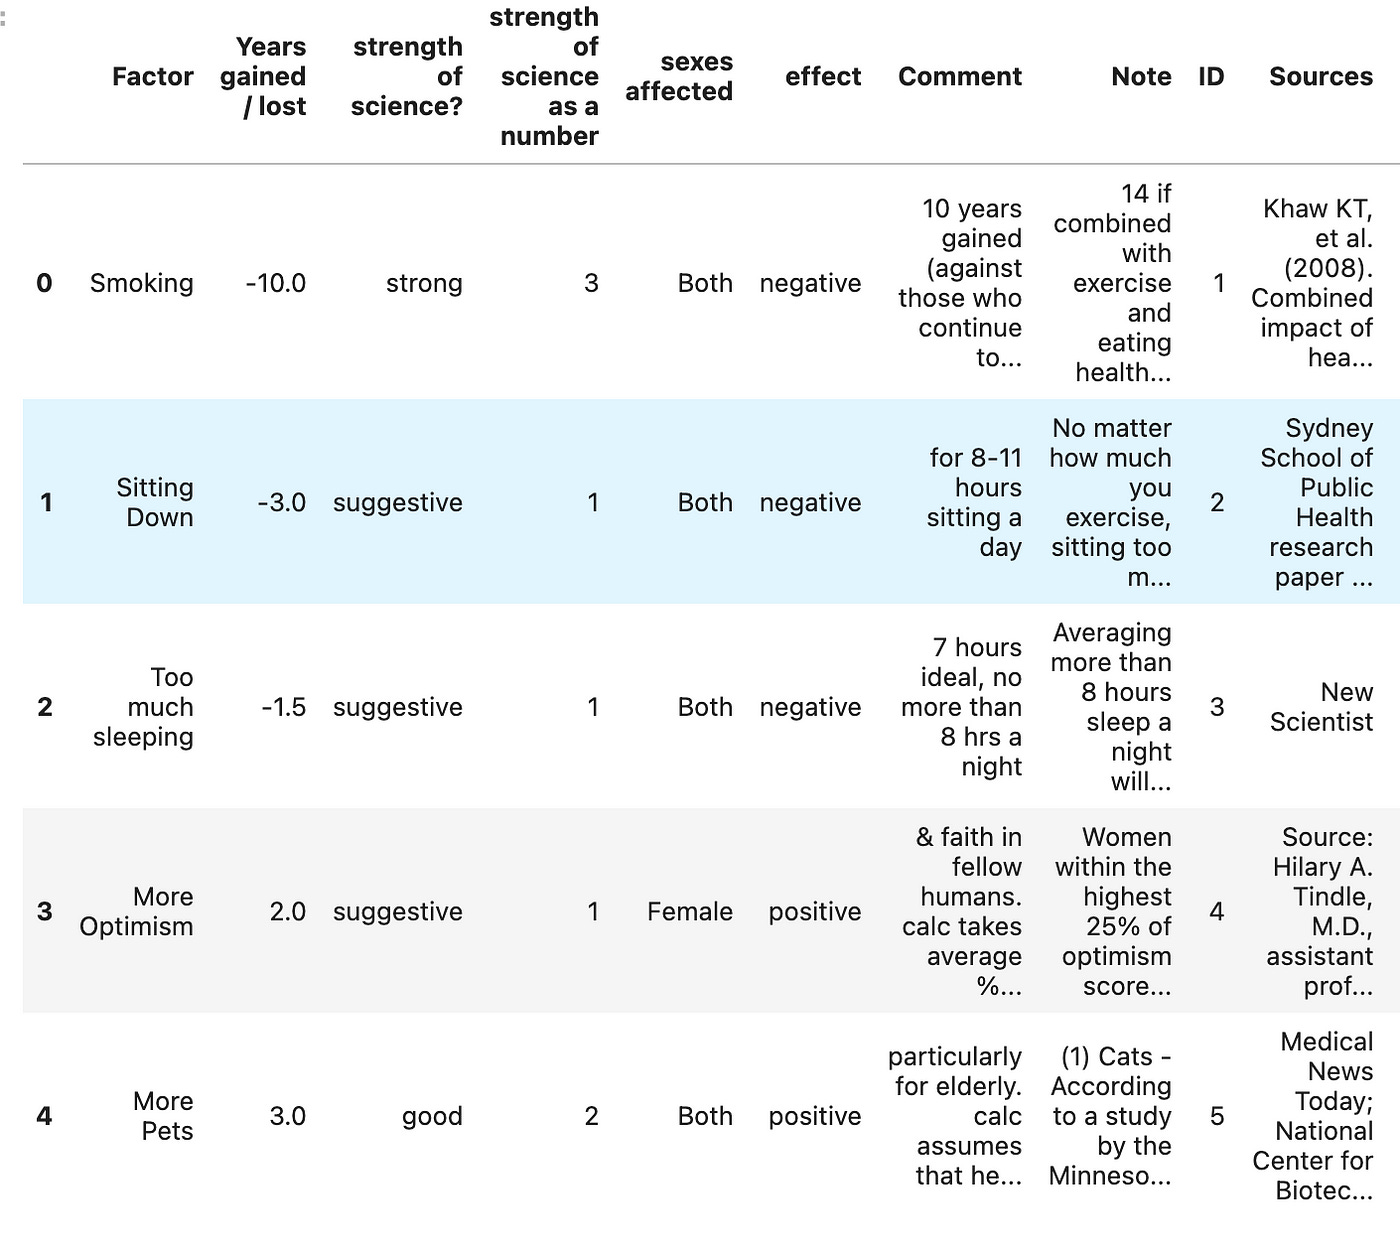
Now, let’s see the columns.
df.info()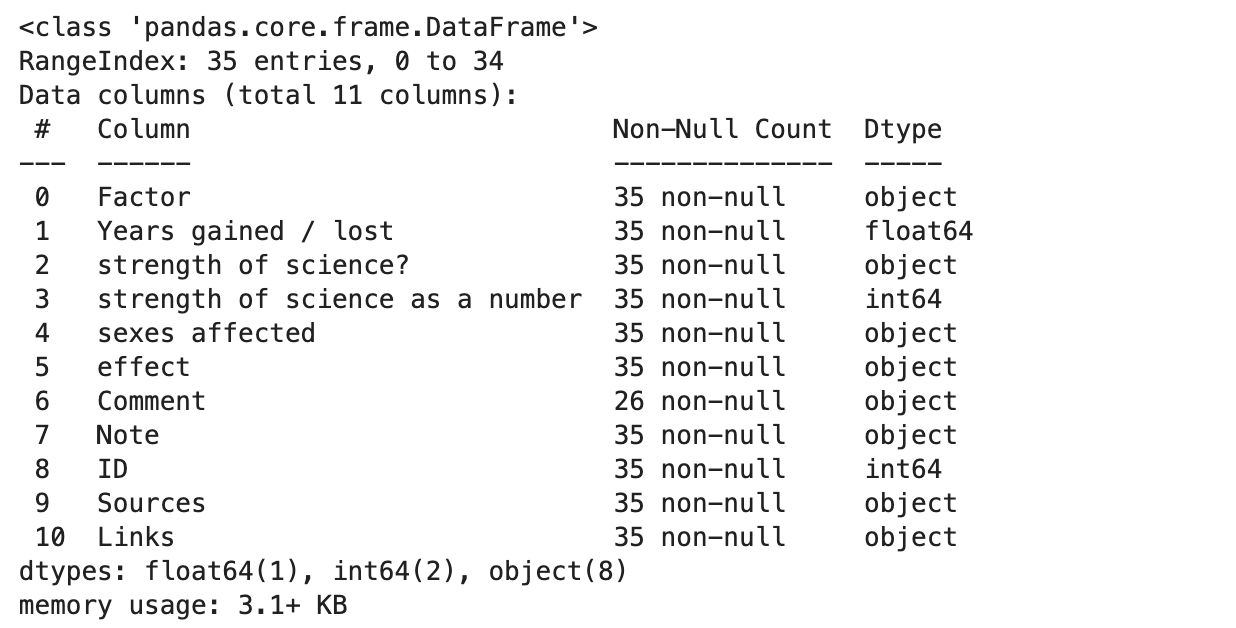
Let’s see the factors.
df["Factors"].value_counts()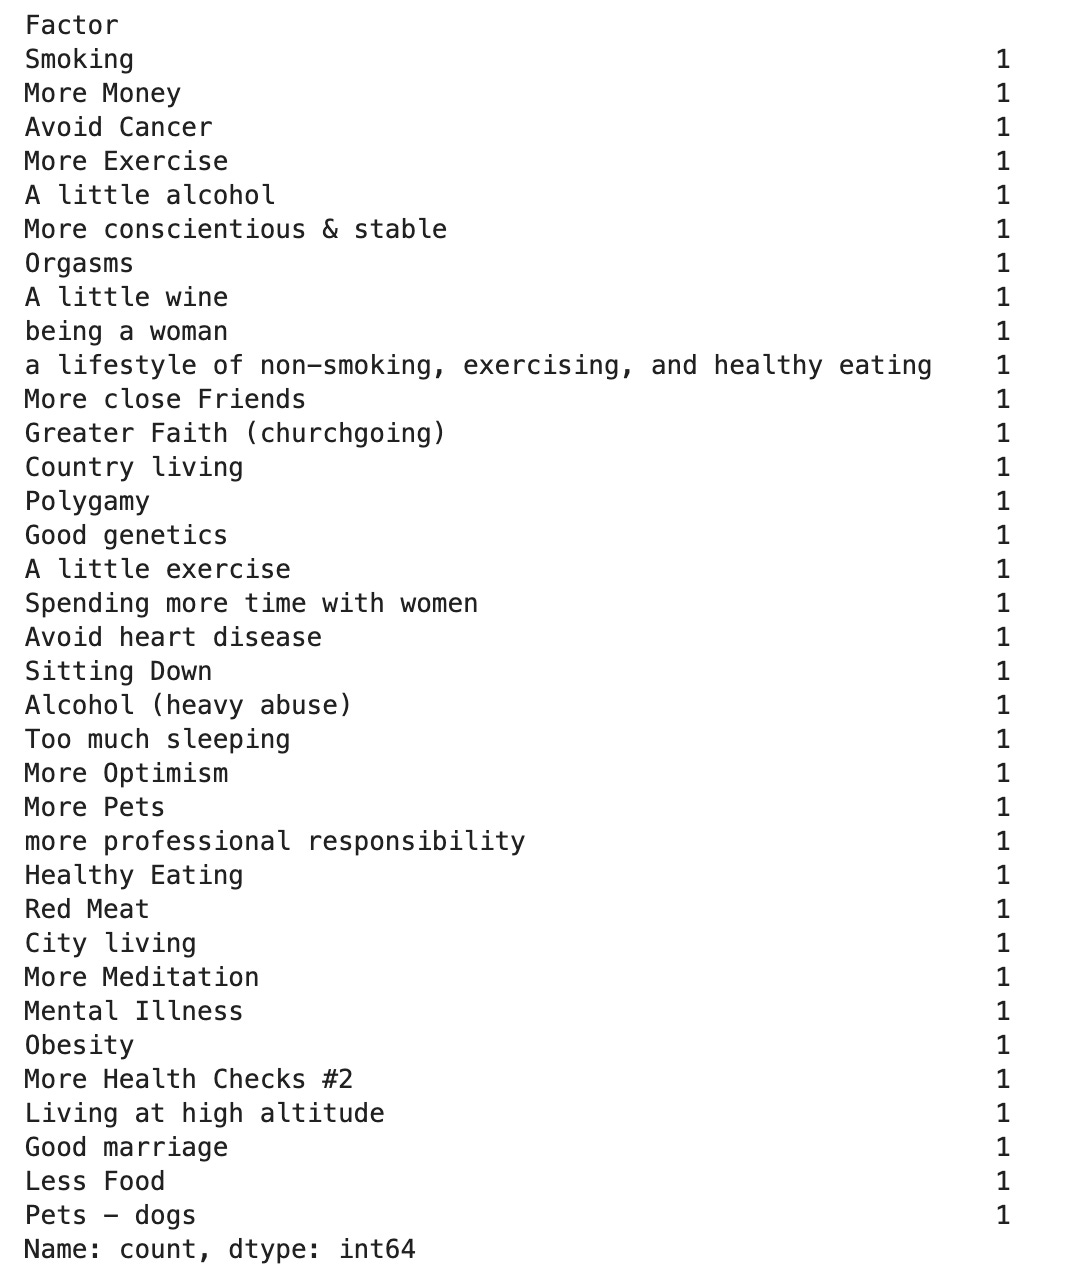
As you can see, this research has been done to analyze different factors and how they affect your life. If you want to read a further analysis, read this one.
Now, let’s test these custom GPTs.