
Data Project 3 : Obesity Analysis
How to prevent it, by using data analysis on the Real-life dataset?

Doing a data project might help you land your data-related job, but not just that, it should be fun, too! In our first Data Project, we explored life longevity factors.
Do you know that consuming less food might lead to an 11.67-year increase in life expectancy, which is more significant than the seven years of healthy eating alone?
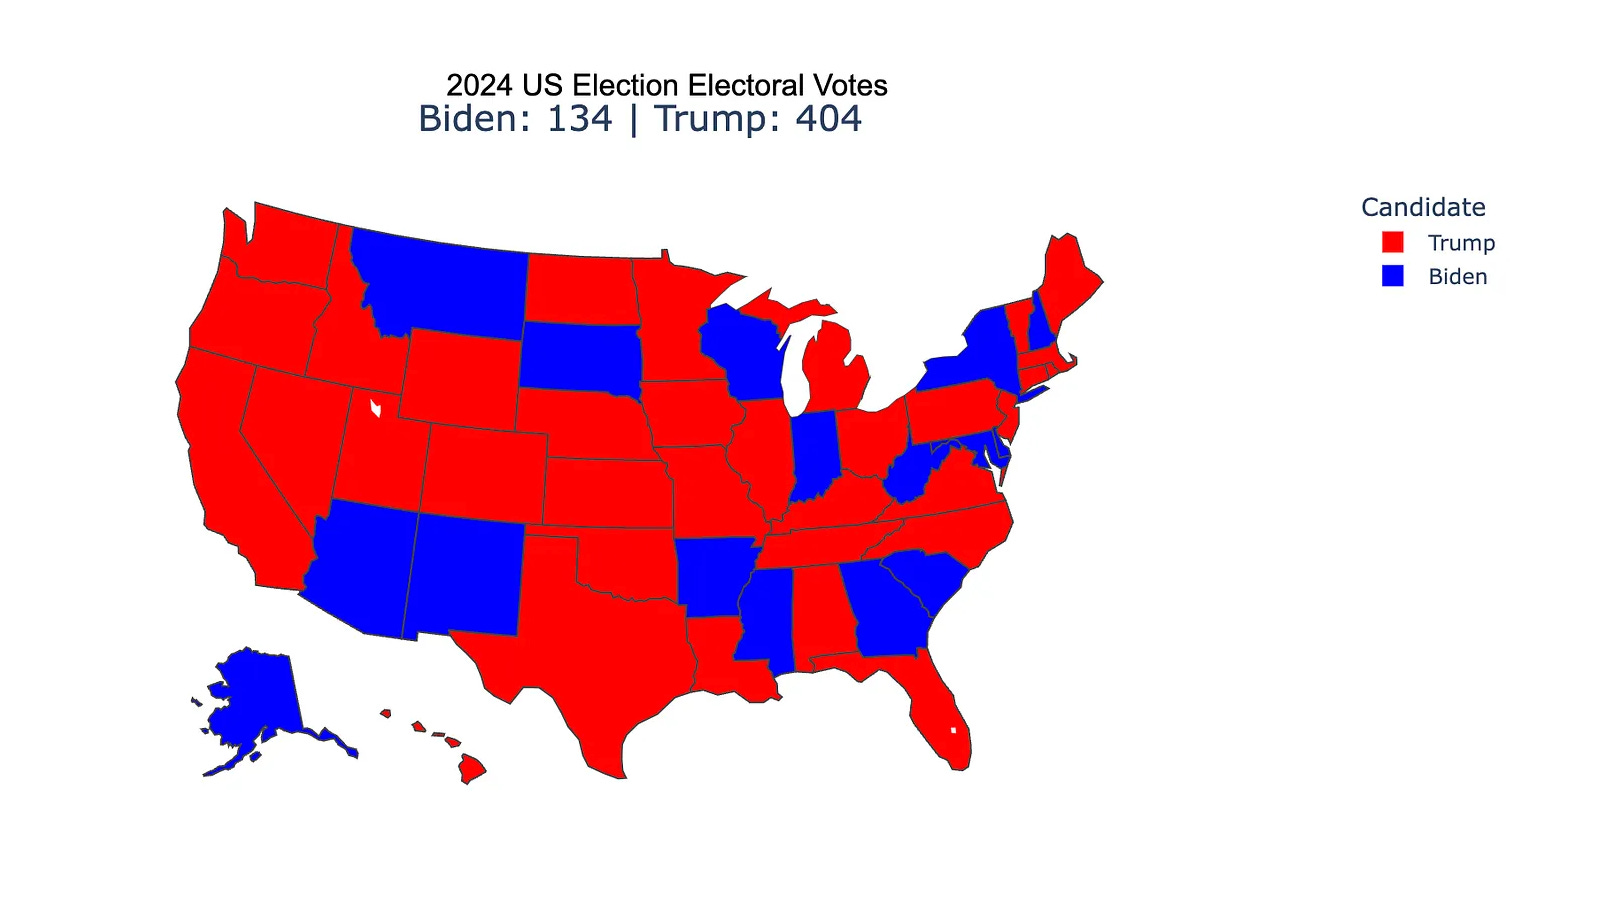
Then, we’ve seen how to predict the presidential election in the USA and created a map like the one below; check it from here.
In this one, we’ll explore the obesity dataset. And at the end of this analysis, you’ll see a solid way of preventing obesity. So let’s get started!
👉 By becoming a paid subscriber, you’ll receive an email with a Google Drive link to access the sources above.
Step 1: Data Exploration
At this step, let’s discover our dataset. Here are the columns of our dataset.
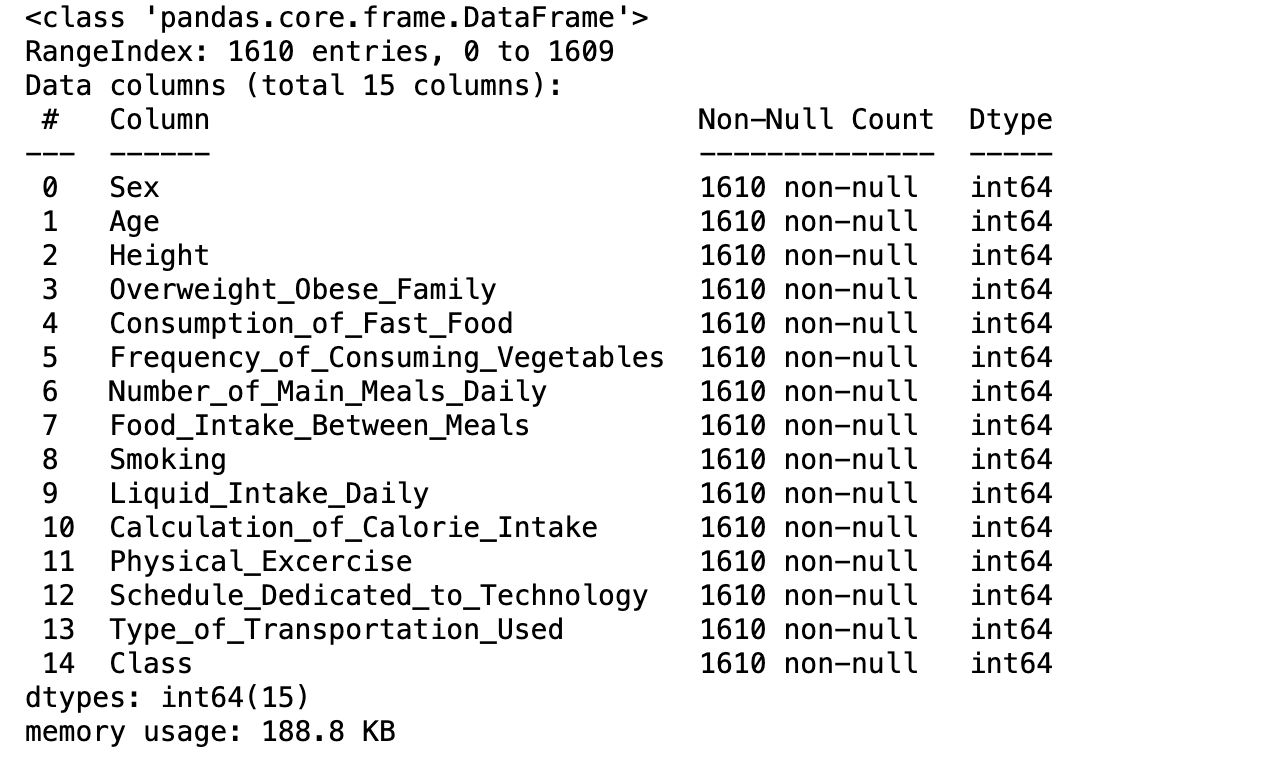
As you can see, our dataset includes too many different features to predict obesity. Phone calls obtain the dataset, and it has been using one of the academic articles and analyses written and done by Koklu, N., & Sulak, S.A. (2024). Using artificial intelligence techniques to analyze obesity. You can read it here.
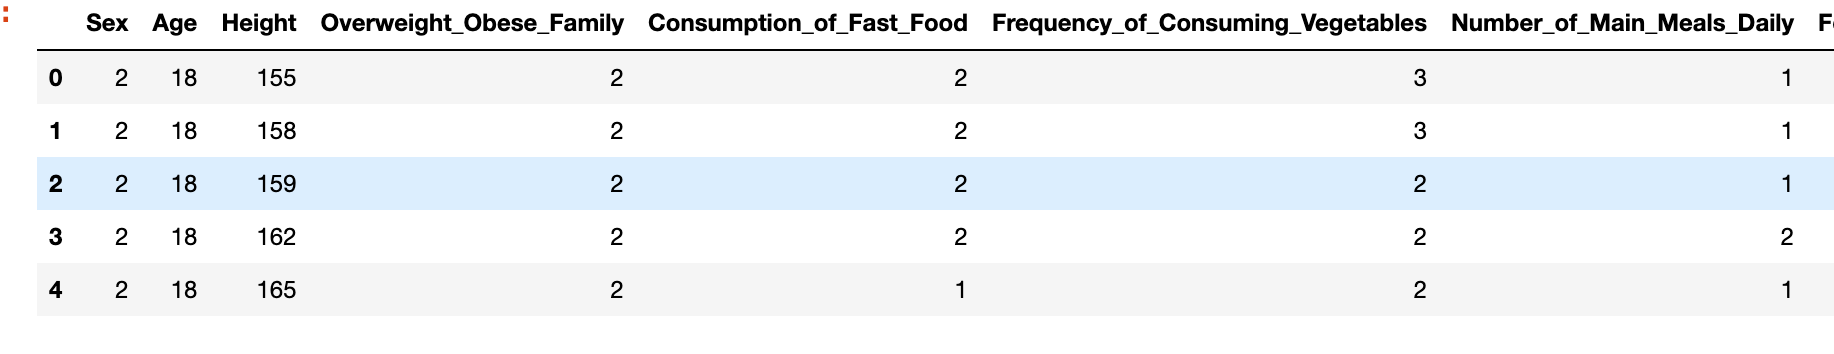
Now, let’s take a glimpse of our dataset. Of course, this does not include all the columns in this section.
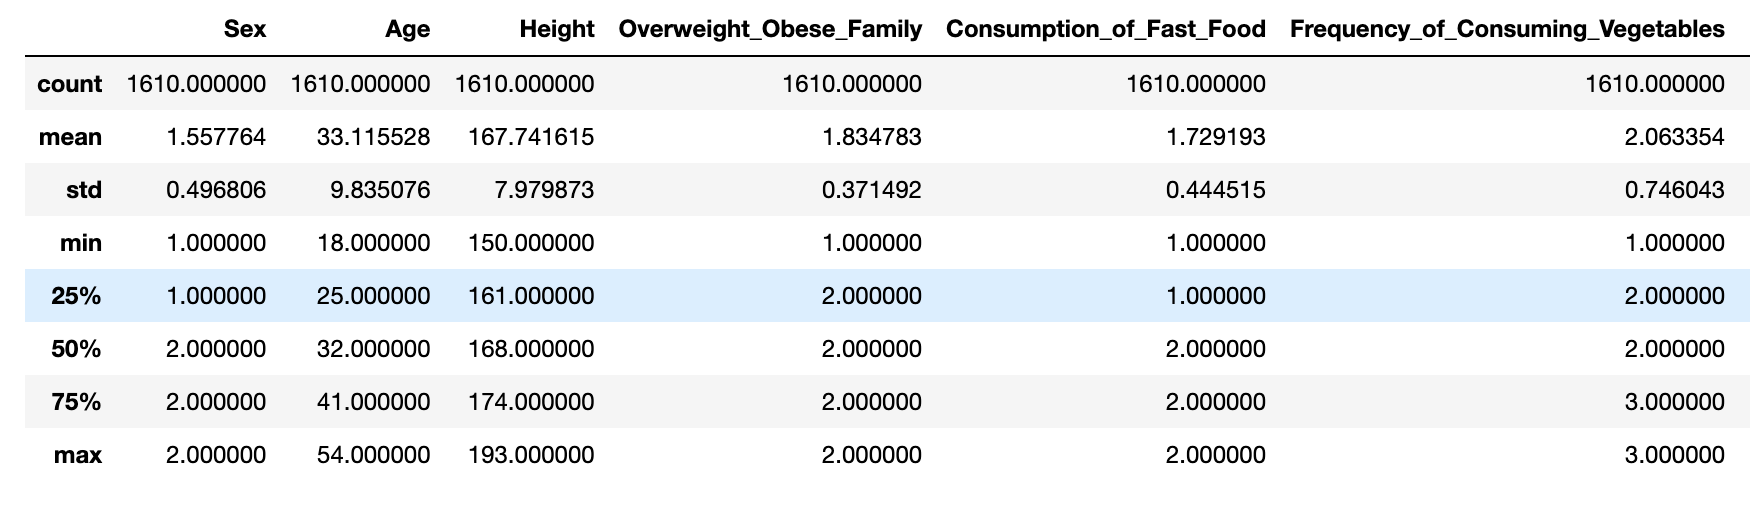
Also, let’s check the numerical values and their distribution.
Great, now let’s continue to the second part.
Step 2: Data Visualization
Now, let’s draw a graph to which we all know the answer, but let’s point out the obvious.
Fast Food vs. Obesity Class
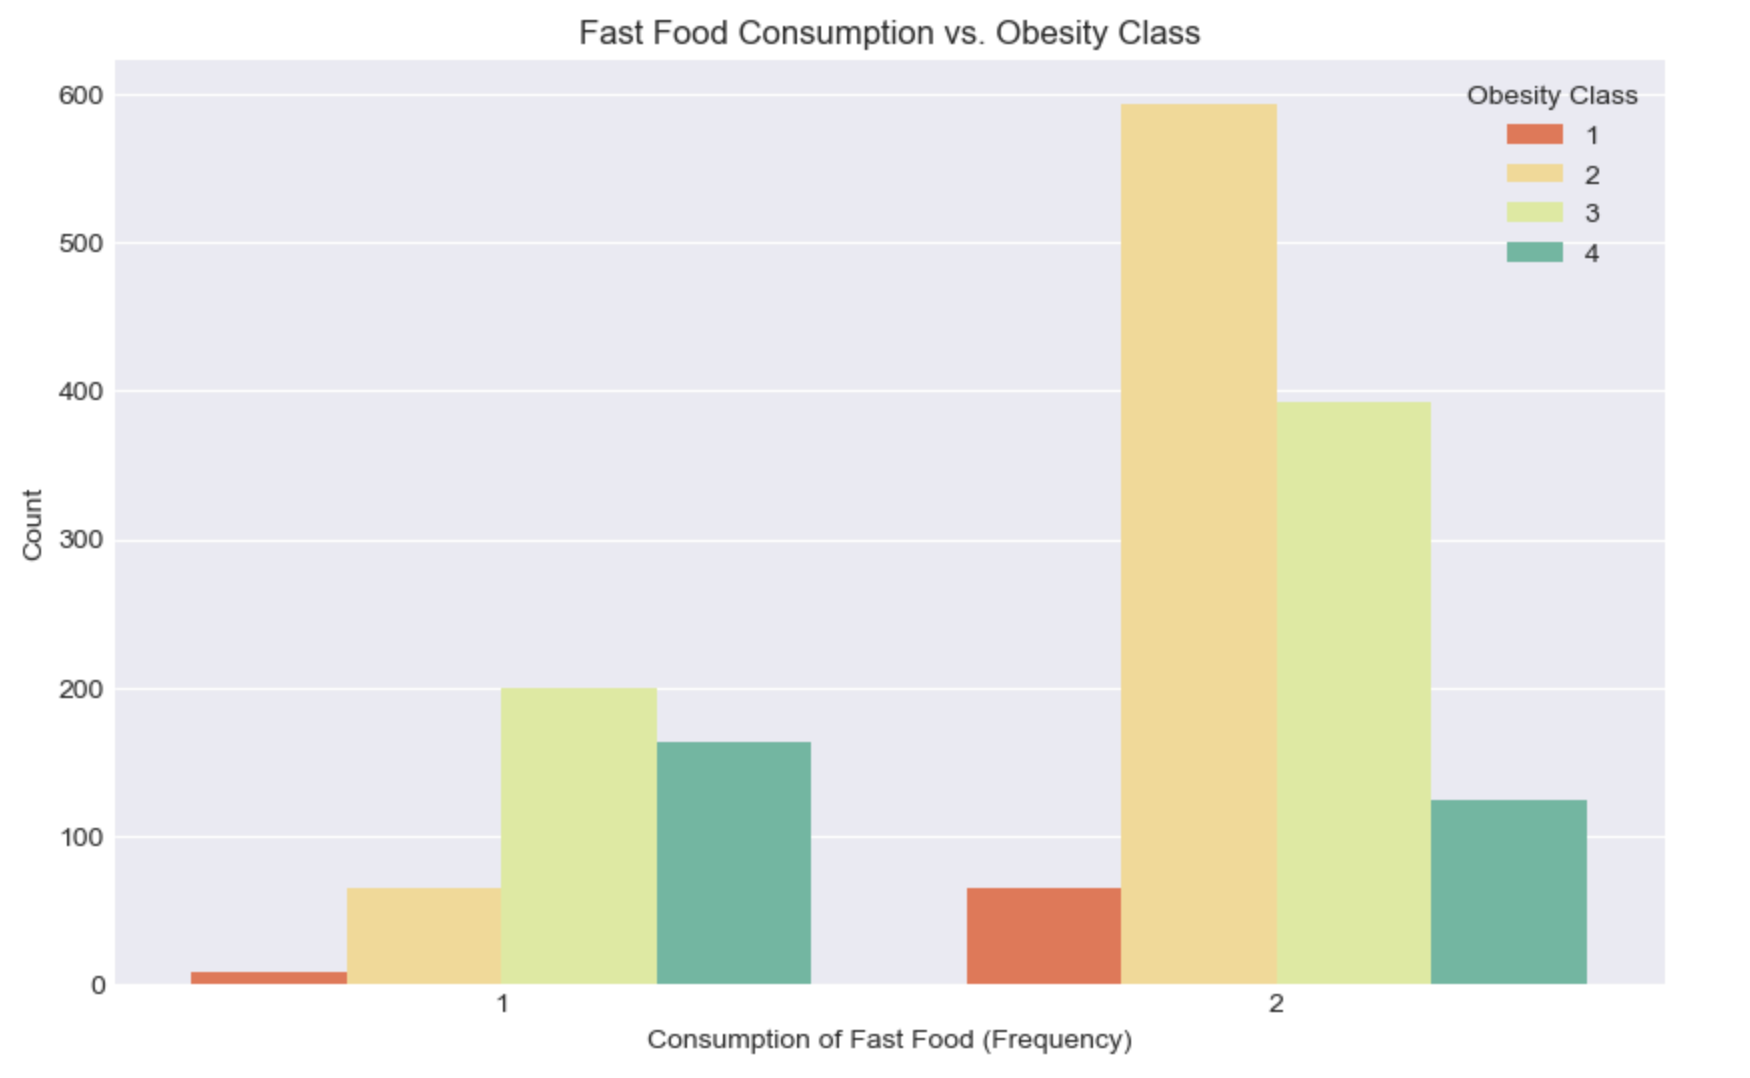
Here, the bar chart shows the link between fast food consumption and obesity class:
People who eat fast food often (labeled as '2') are mostly in Class 2 and Class 3 obesity groups.
Those who eat less fast food (labeled as '1') are spread more evenly across the classes, with fewer in Class 1.
This shows that eating fast food more often is tied to higher obesity levels. In the source code, we also have drawn the following graphs;
Obesity Class Distribution: Show a bar chart showing how common each obesity class is.
Age by Obesity Class: Use a boxplot to show how age varies in different obesity classes.
Correlation Heatmap: Create a heatmap to see the links between food, exercise, and obesity.
Physical Exercise Levels: Show a bar chart of exercise levels within each obesity class.
Step 3: Machine Learning
At this step, we have applied five different regression models to predict obesity simultaneously and compared them using two different metrics: R squared and MSE.
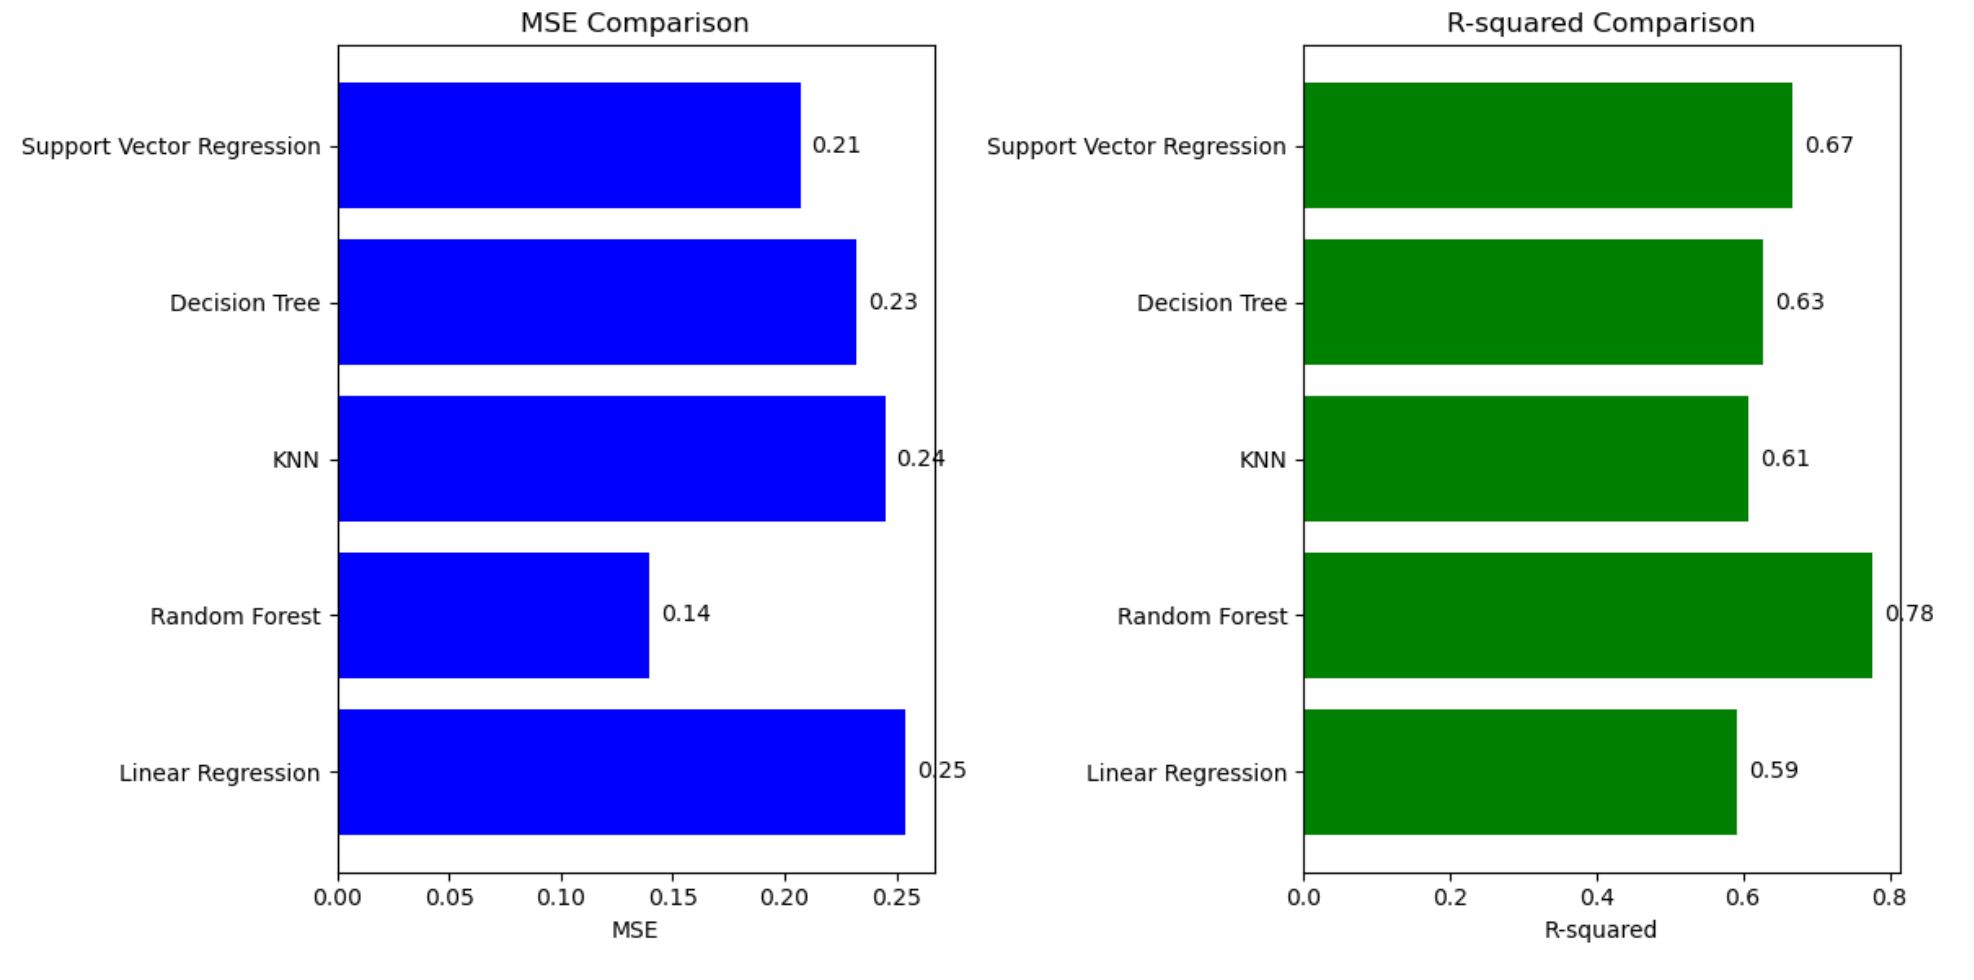
The academic article shows that they can predict obesity using a random forest of 87.82%. But our mission here is not to predict obesity using ML; here, we will ask questions, and you will see.
Step 4 : Asking Questions
Now, here , we will ask questions about the dataset and try to obtain the result.
Does eating more vegetables lead to fewer people being obese?
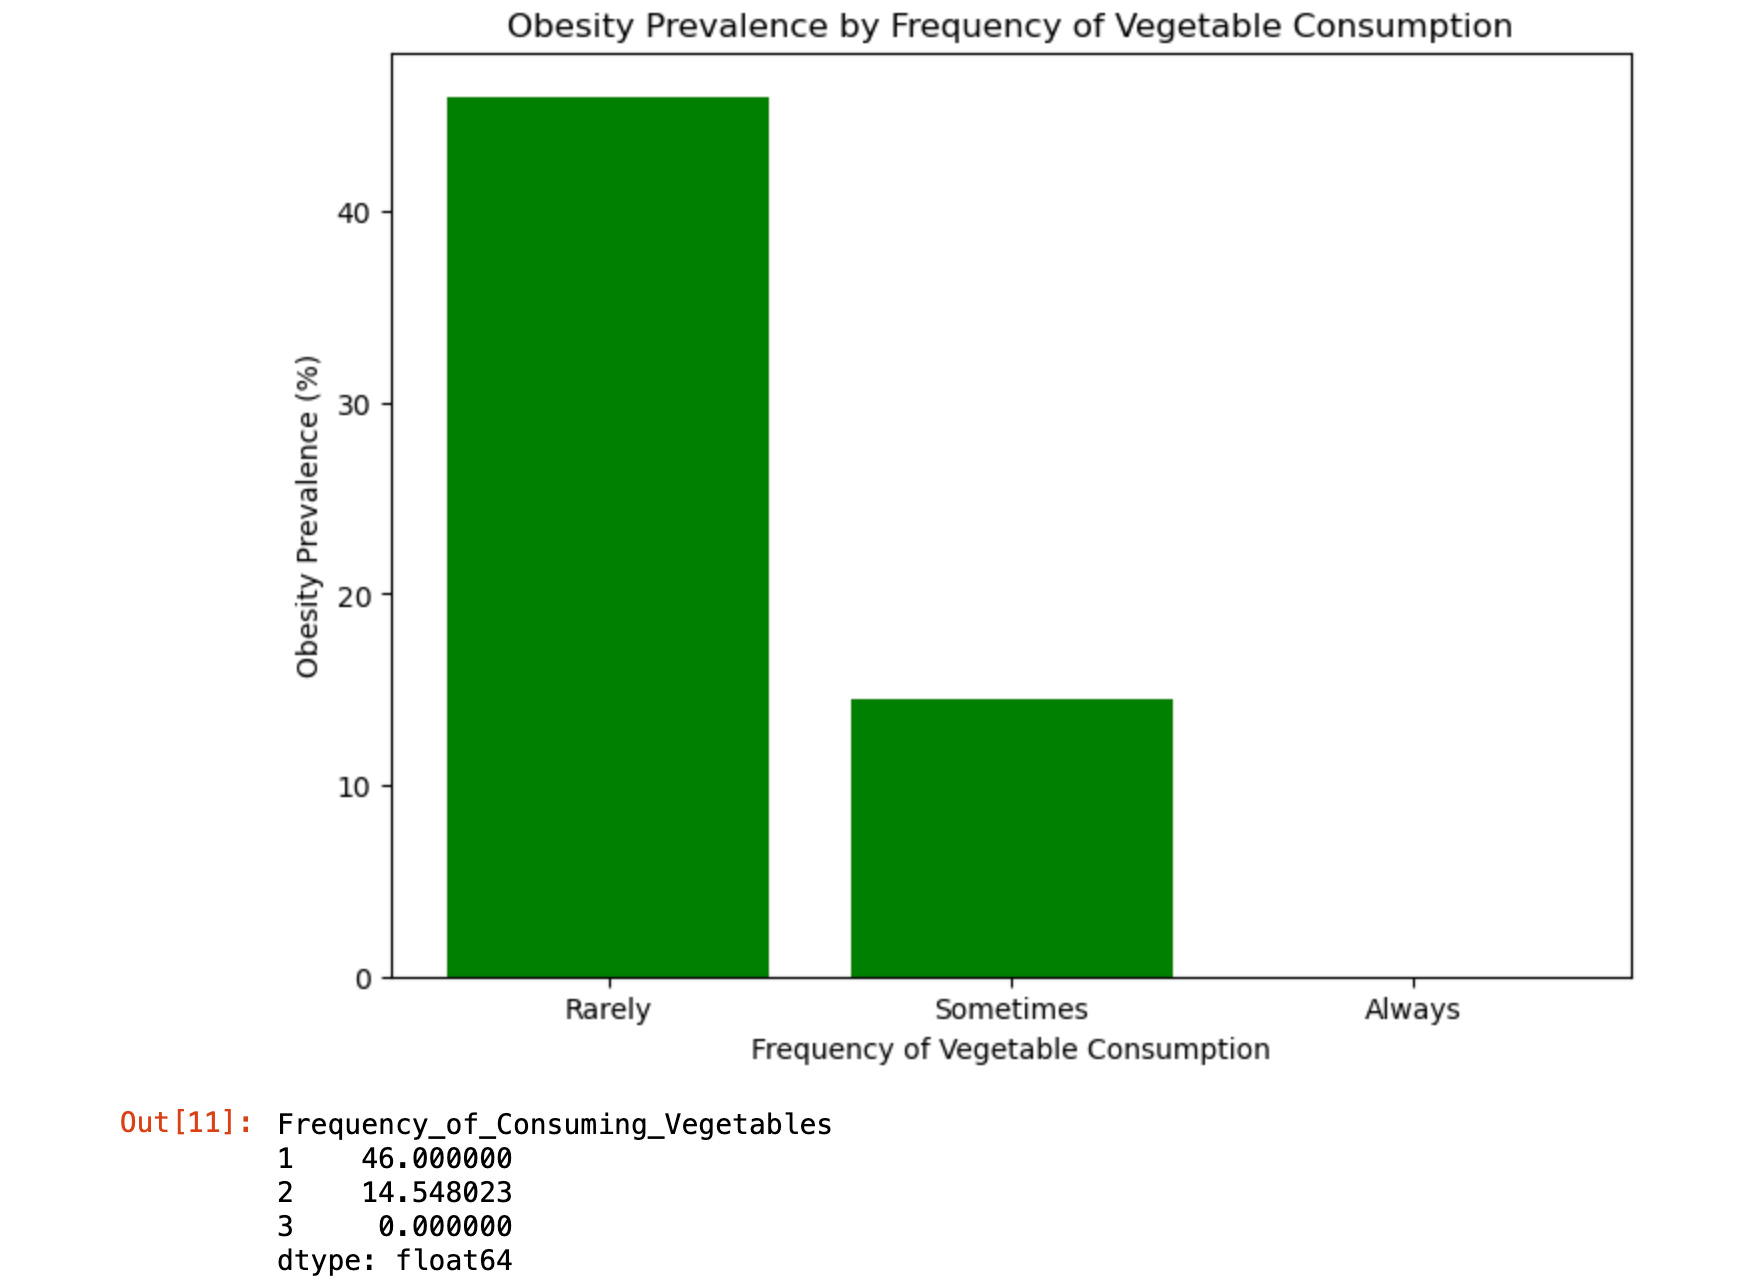
The graph shows a clear link between eating more vegetables and fewer people being obese, as seen:
Rarely: 46% of people are obese
Sometimes: 14.55% of people are obese
Always: 0% of people are obese
If you eat your vegetables more often, the probability of obesity will be almost 0.
Are people who eat more than three meals a day more likely to be obese?
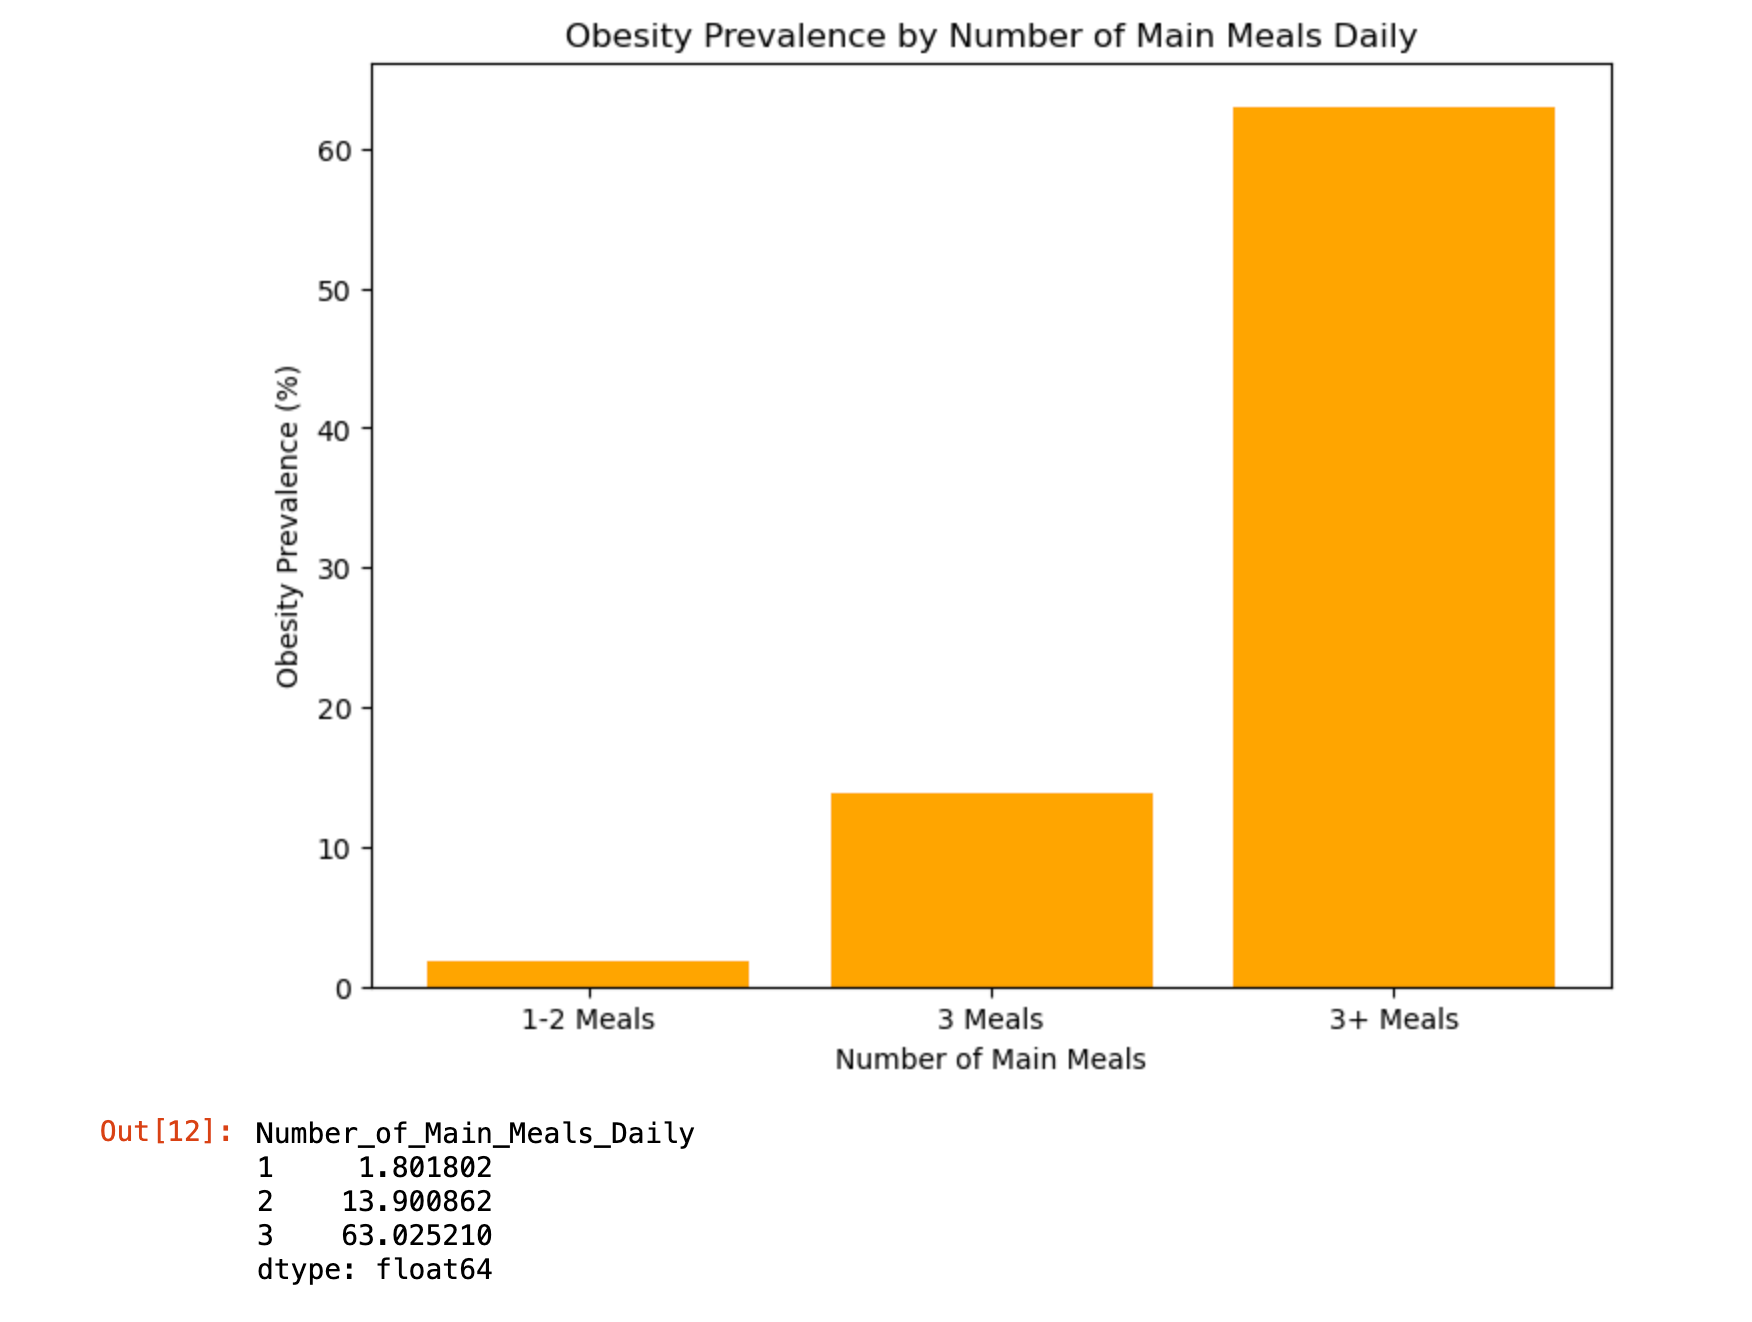
The graph shows how common obesity is based on the number of main meals eaten each day:
1-2 meals: 1.80% of people are obese
Three meals: 13.90% of people are obese
More than three meals: 63.03% of people are obese
We have also asked the following questions;
Is there a big difference in obesity rates between smokers and non-smokers?
How does the obesity rate change in different age groups?
Do individuals who consume fast food and engage in low physical activity have higher obesity rates than those who do not?
How do healthy versus unhealthy lifestyle choices impact obesity rates?
How do healthy and unhealthy lifestyle habits affect obesity rates? ( Here we get %100!)
You can find the outputs of these questions, here.
Final Thoughts
In this data project, we have discovered a way to prevent obesity once and for all. We also explore and visualize the dataset and apply five regression models to predict obesity.
Thanks for reading this one!