
I Used to Read. Now I See with Nano Banana Pro
The prompt system that turns any learning material into infographics using Nano Banana


Nano Banana Pro isn’t just an image-generation model anymore.
Let’s see how it made learning easier.
Content Table
Learn From the Book
Step 1: Extract Information
Step 2: Nano Banana Pro
Modular Prompt
YouTube to Visual Summary: Learn While You Watch
More Infographic Examples
Paper to Infographics
Concept Explainer
Comparison Chart
Timeline
Learn From the Book
Let’s take a book about Machine Learning written by professors from the University of Maryland. Here is the link.
You can select any chapter of this book from here
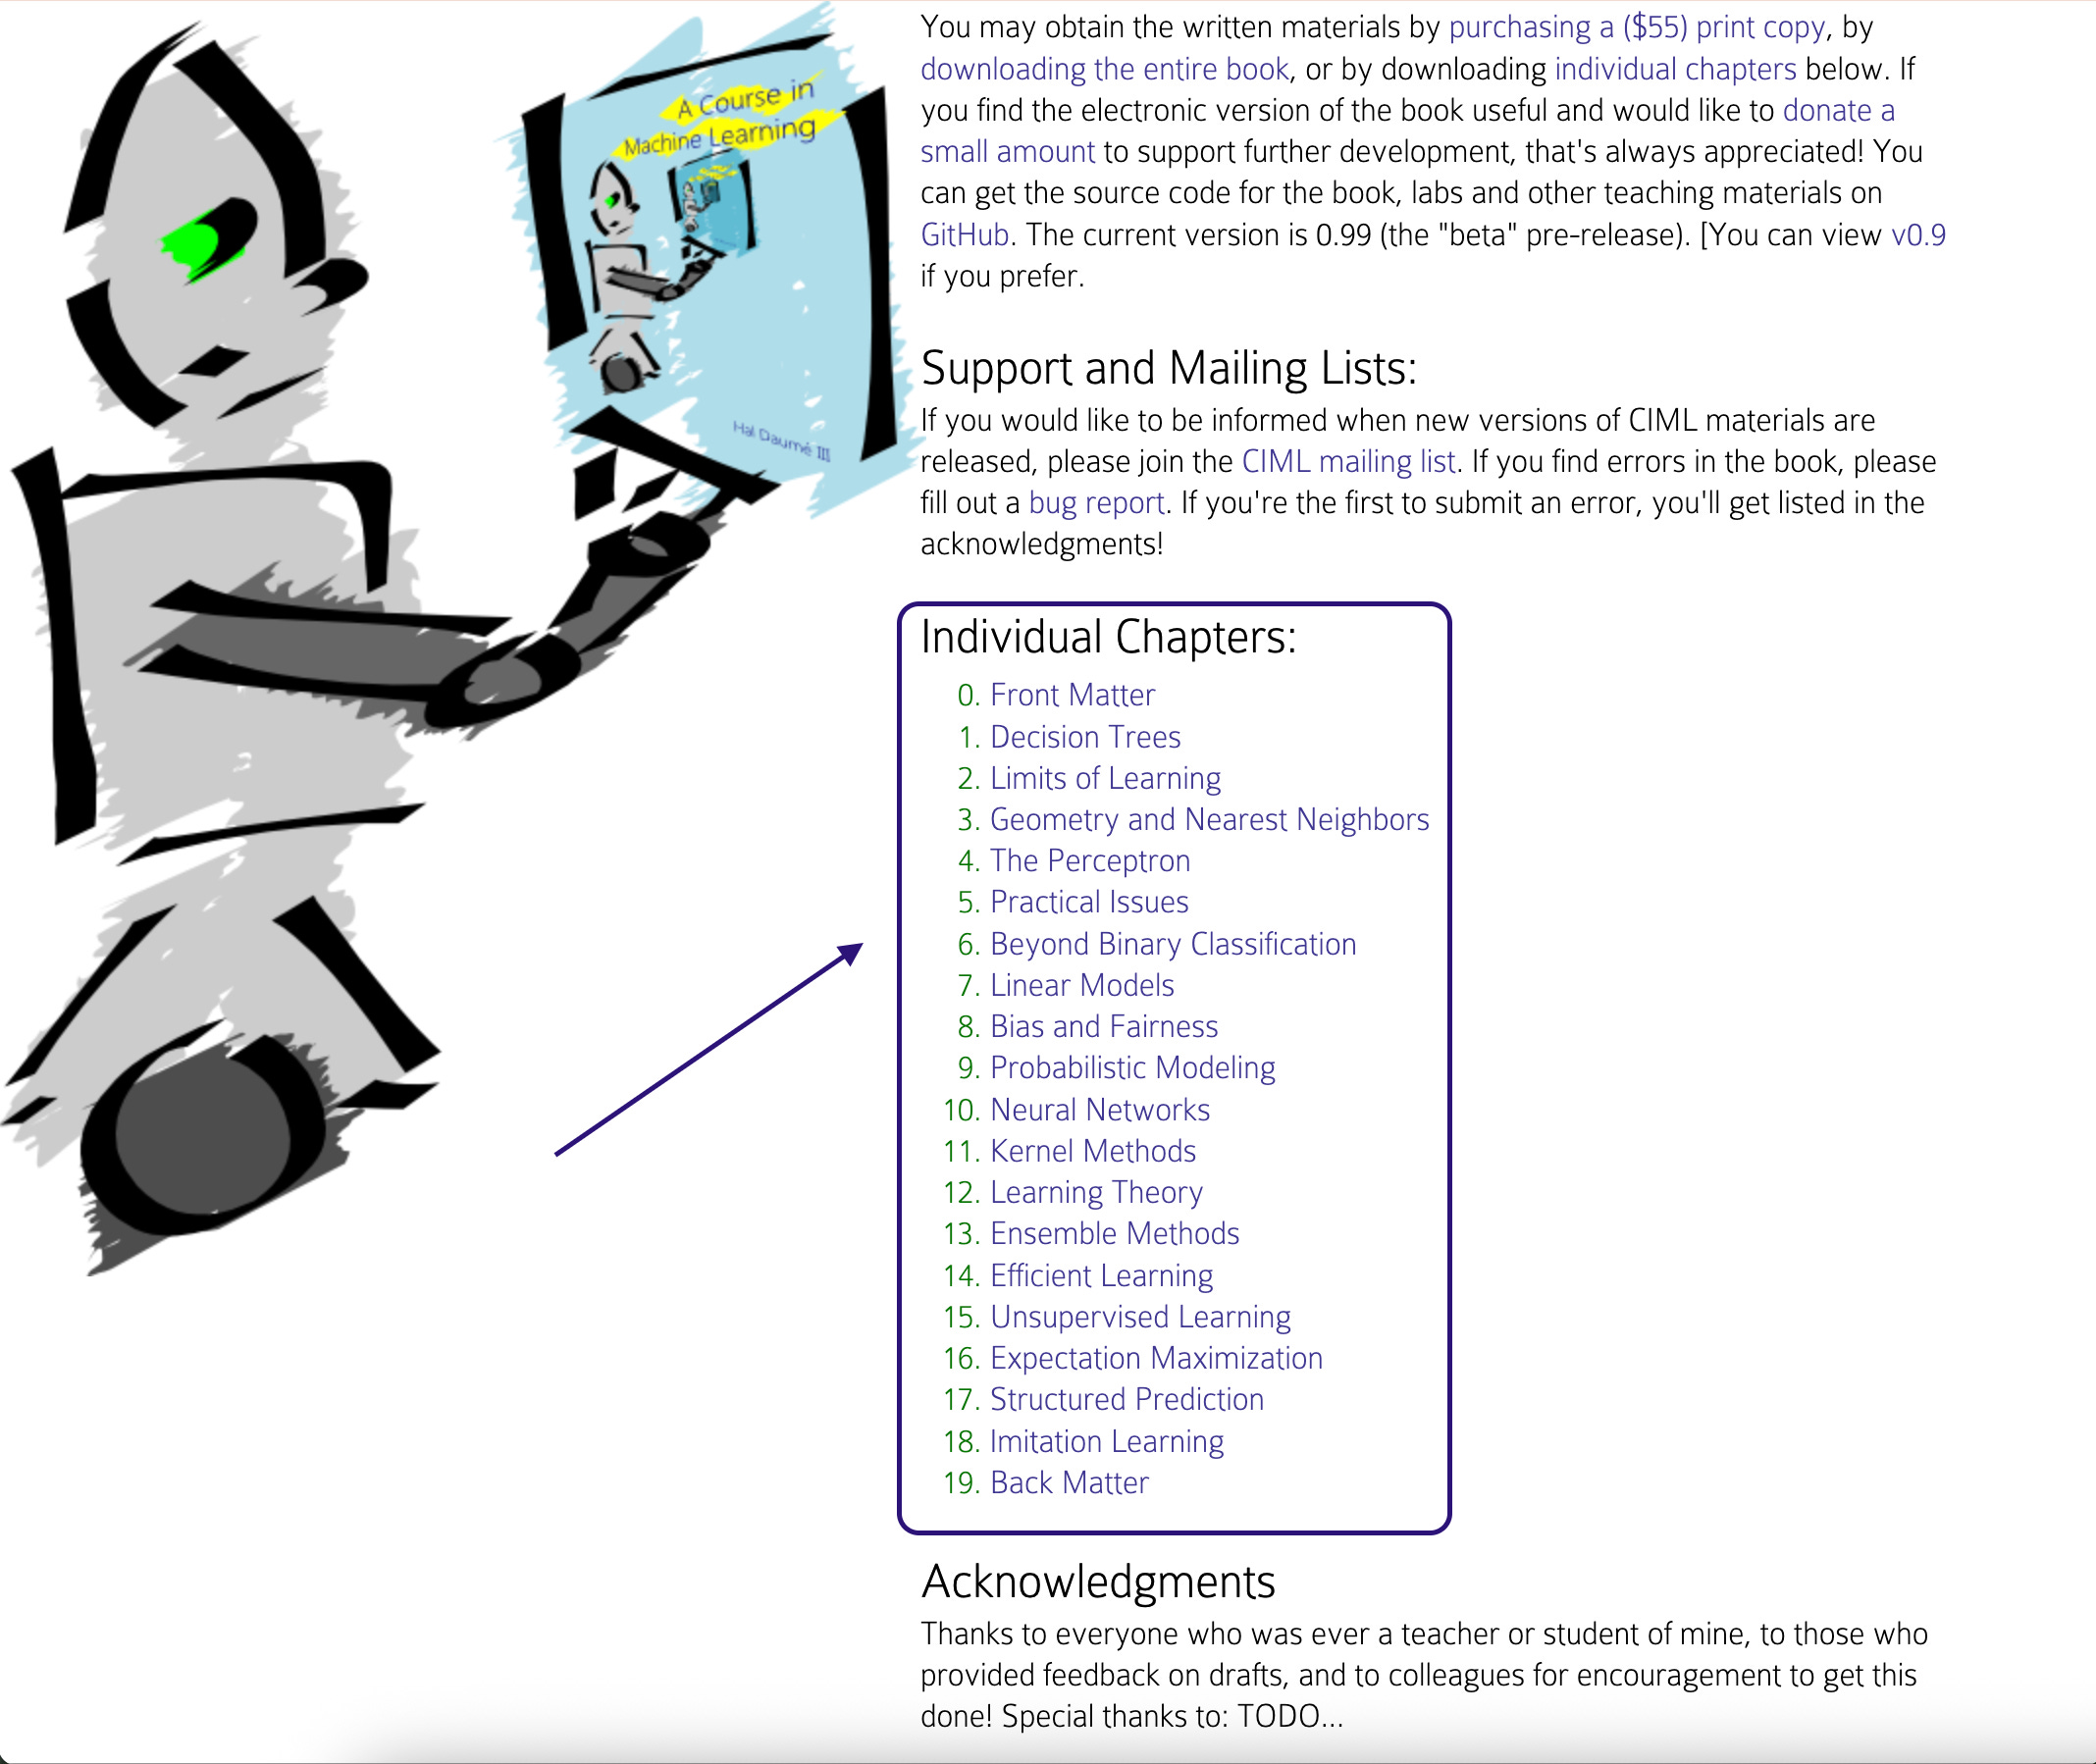
Let’s click on the Decision Tree and download the PDF.
Step 1- Extract Information
Attach the PDF you downloaded after clicking on it. (don’t select nanobanan pro as tool yet!.)
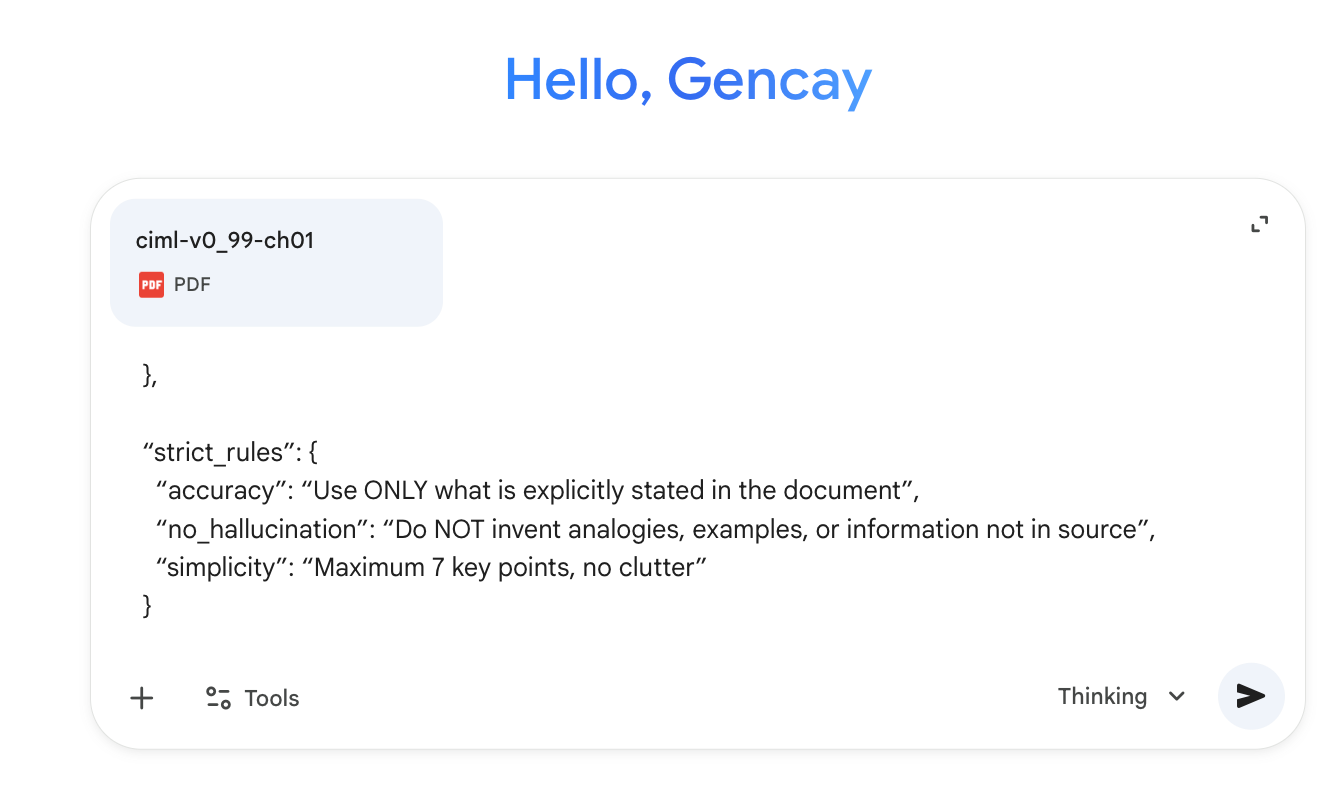
You saw the prompt above, which is in JSON(JavaScript Object Notation). Why?
Because JSON prompts give the AI a clear structure, they produce more consistent results.
Let’s see the prompt.
It explains everything: task, type, content, output format, and learning style.
{
  “instructions”: “Analyze the attached PDF. Extract the key information and create a Nano Banana Pro prompt that will generate an infographic based on this content.”,

  “source”: {
    “type”: “PDF document”,
    “content”: “[attached doc]”,
    “instruction”: “Use ONLY the information in this document. Do NOT add external knowledge.”
  },

  “task”: {
    “step_1”: “Extract main concepts, key points, and structure from the document”,
    “step_2”: “Organize the information into maximum 7 clear points”,
    “step_3”: “Write a complete Nano Banana Pro prompt that will generate an infographic with this extracted information”
  },

  “output_format”: {
    “part_1”: “Summary of extracted key points (bullet list)”,
    “part_2”: “Ready-to-use Nano Banana Pro prompt for infographic generation”
  },

  “learning_style”: {
    “method”: “[Feynman Technique]”
  },

  “visual_preferences”: {
    “aspect_ratio”: “[16:9]”,
    “style”: “[Clean sketch]”,
    “colors”: {
      “primary”: “[white+black]”,
      “accent”: “[gold]”
    }
  },

  “strict_rules”: {
    “accuracy”: “Use ONLY what is explicitly stated in the document”,
    “no_hallucination”: “Do NOT invent analogies, examples, or information not in source”,
    “simplicity”: “Maximum 7 key points, no clutter”
  }
}
Paste this prompt and send it.
Let’s see the result.
As you can see, Part 1 includes what it extracts, and Part 2 has the prompt we’ll use in the next step to generate the infographics.
Step 2 - Nano Banana Pro
In this step, open a new chat and paste the prompt that you copied, which was produced by Gemini in step 1.
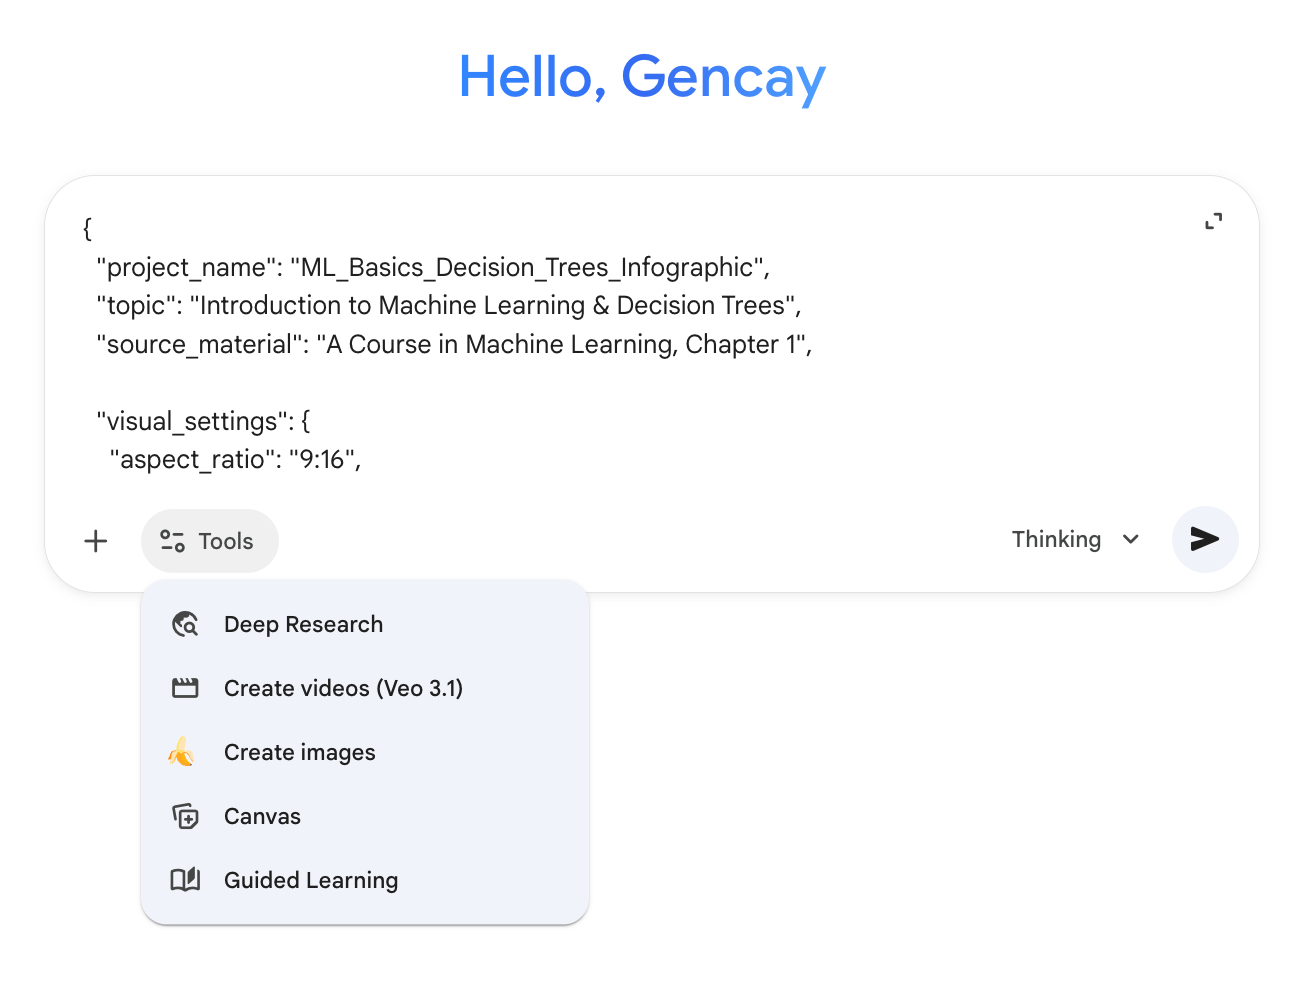
And after clicking on the tools, select “Create Images” as you can see above. Here is the result.
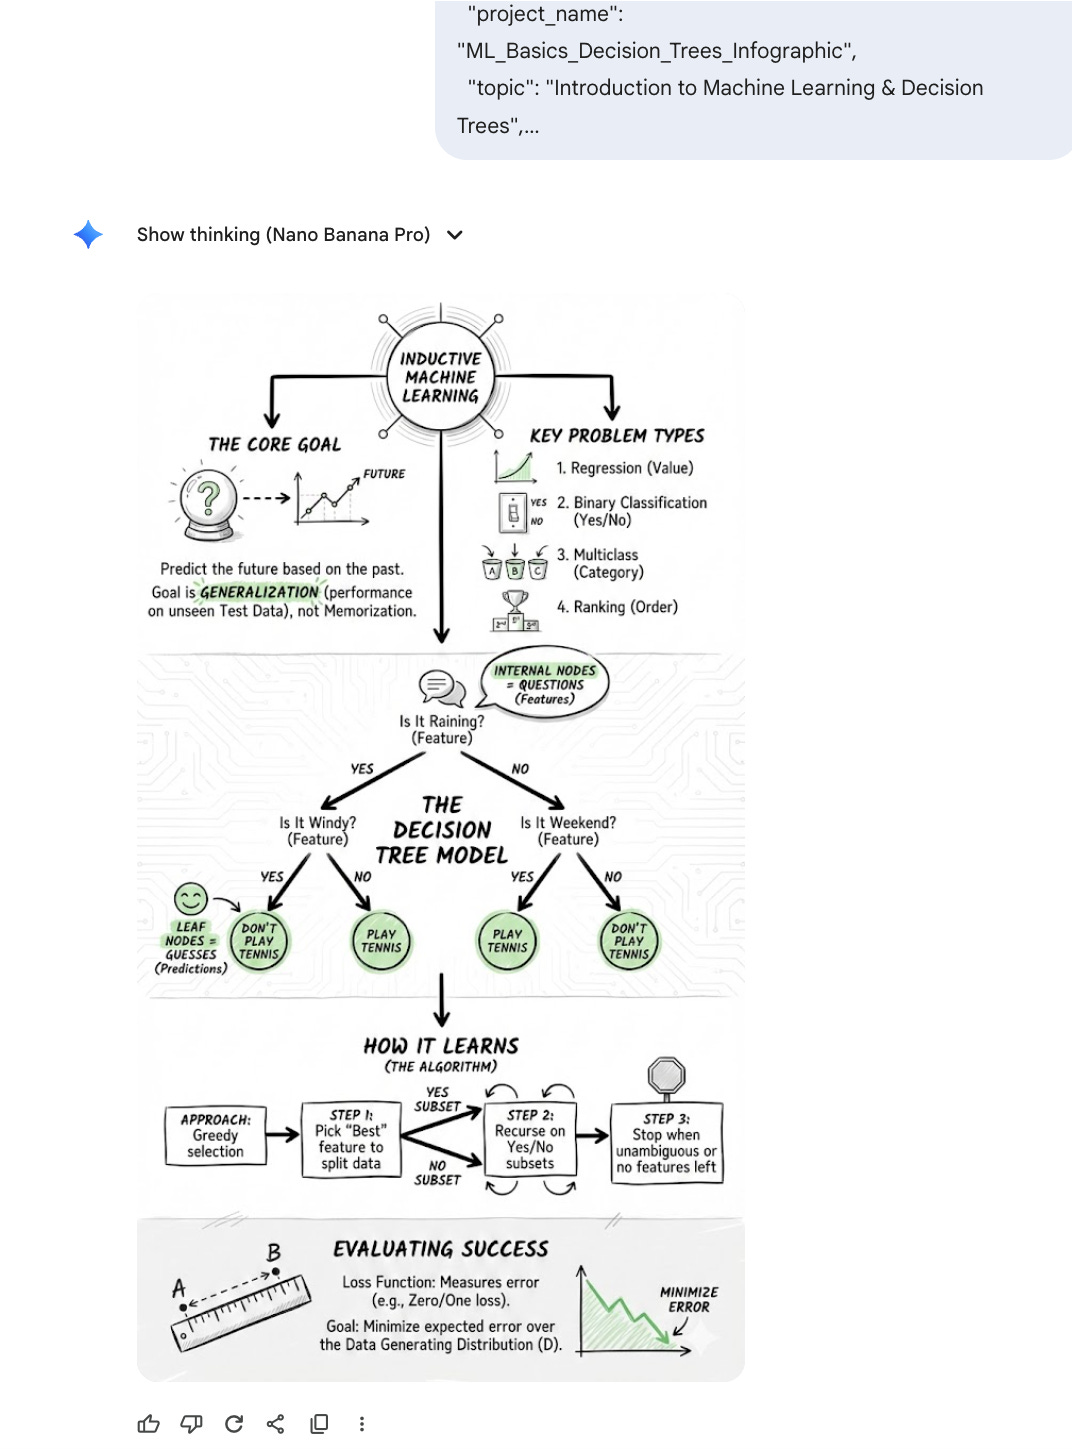
The analogy is easy: you want to play tennis, and to do that, there should be rain. And the infographic explains this using a decision tree, showing even how the algorithm learns.
Don’t like it?
Totally understandable.
Each one of us has a different learning style.
With the modular prompt below, you can customize everything.
Prefer Feynman Technique over Mind Mapping? Switch it. Want a hand-drawn sketch instead of a flat design? One word change. Need a vertical format for Instagram or a landscape for LinkedIn? Just pick your aspect ratio. You control the learning method, the visual style, the color palette, and even the complexity level.
One prompt, infinite variations, tailored exactly to how your brain learns best.
