
# Data Project 2, Election Prediction : A Data Project Will Definitely Get You a Job Offer
In 2024, More Than 60 Nations to Hold National Elections.


2024 is an election year because more than 60 Nations, including the United States, will hold national elections.
This holds great opportunities for you if you are pursuing a related career. Because the majority of the world population will vote this year, and if the recruiter sees this project on your portfolio, I assure you he/she will look at your CV in detail.
And that will give you the opportunity to show yourself. Now, in this one, I’ll direct you to the steps to do this data project.
# Step 1 Finding Dataset
I highly suggest you scrape this dataset through Twitter by using Twitter API. If you don’t know how to use it, this might be your chance to develop yourself. I assure you, it is very easy. Watch this one if you want to learn it :
However, if you are new and don’t want to learn this one, you can do your data projects using this Kaggle dataset.
#Step 2 Data Exploration
Here is just one data that we’ll use. It contains 970K tweets collected from Twitter.
We have 2 different datasets; one is the tweets about Trump, and the other one is for Biden.
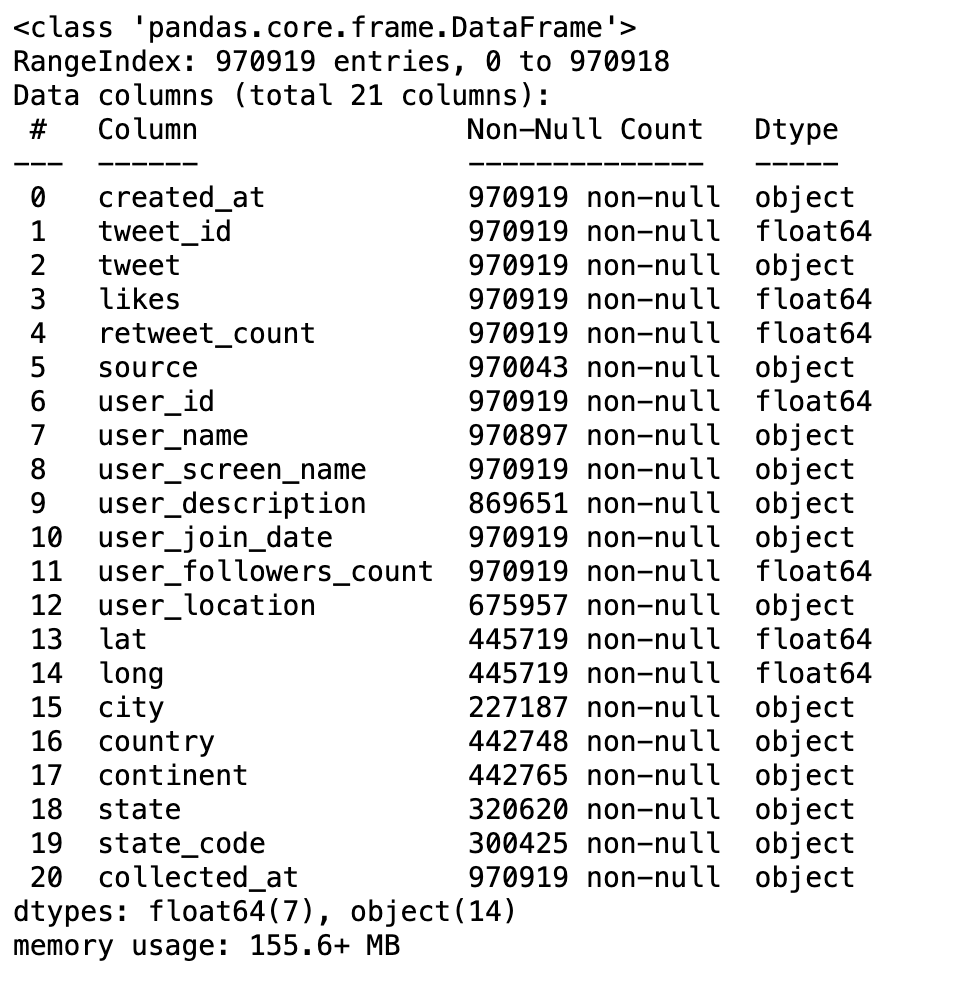
We notice how the datasets for Trump and Biden are structured, focusing on key columns like tweet content, likes, and retweets, which might hint at public sentiment. We also observe geographical data like user locations, providing a glimpse into the diverse origins of these tweets.
Interestingly, we consider the potential of this data to unlock insights into public opinion during the election.