Data Project 6: I Analyzed 77,108 NYC Real Estate Sales.
Here's What The Data Reveals About Property Values.
The data doesn’t lie about what works in New York City real estate, and what doesn’t.
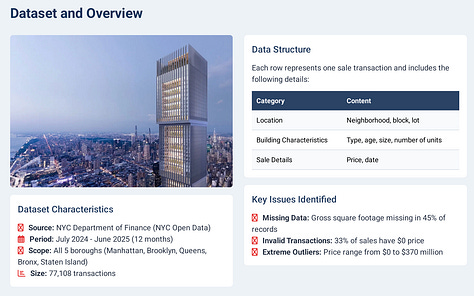
Between July 2024 and June 2025, New York City recorded 77,108 property transactions across 254 neighborhoods spanning all five boroughs.
Behind every sale lies a story about value, risk, and investment strategy. I dissected the dataset shared by the NYC government to answer questions most real estate analyses ignore, like;
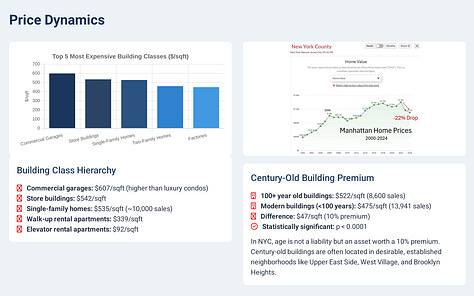
Which building classes receive the best deals?
Where are the quiet neighborhoods that are appreciating without the hype?
At what building size does price per square foot peak?
(..4 more questions.)
The answers surprised me. And they might change how you think about New York City property. I transformed the entire analysis into slides using AI.


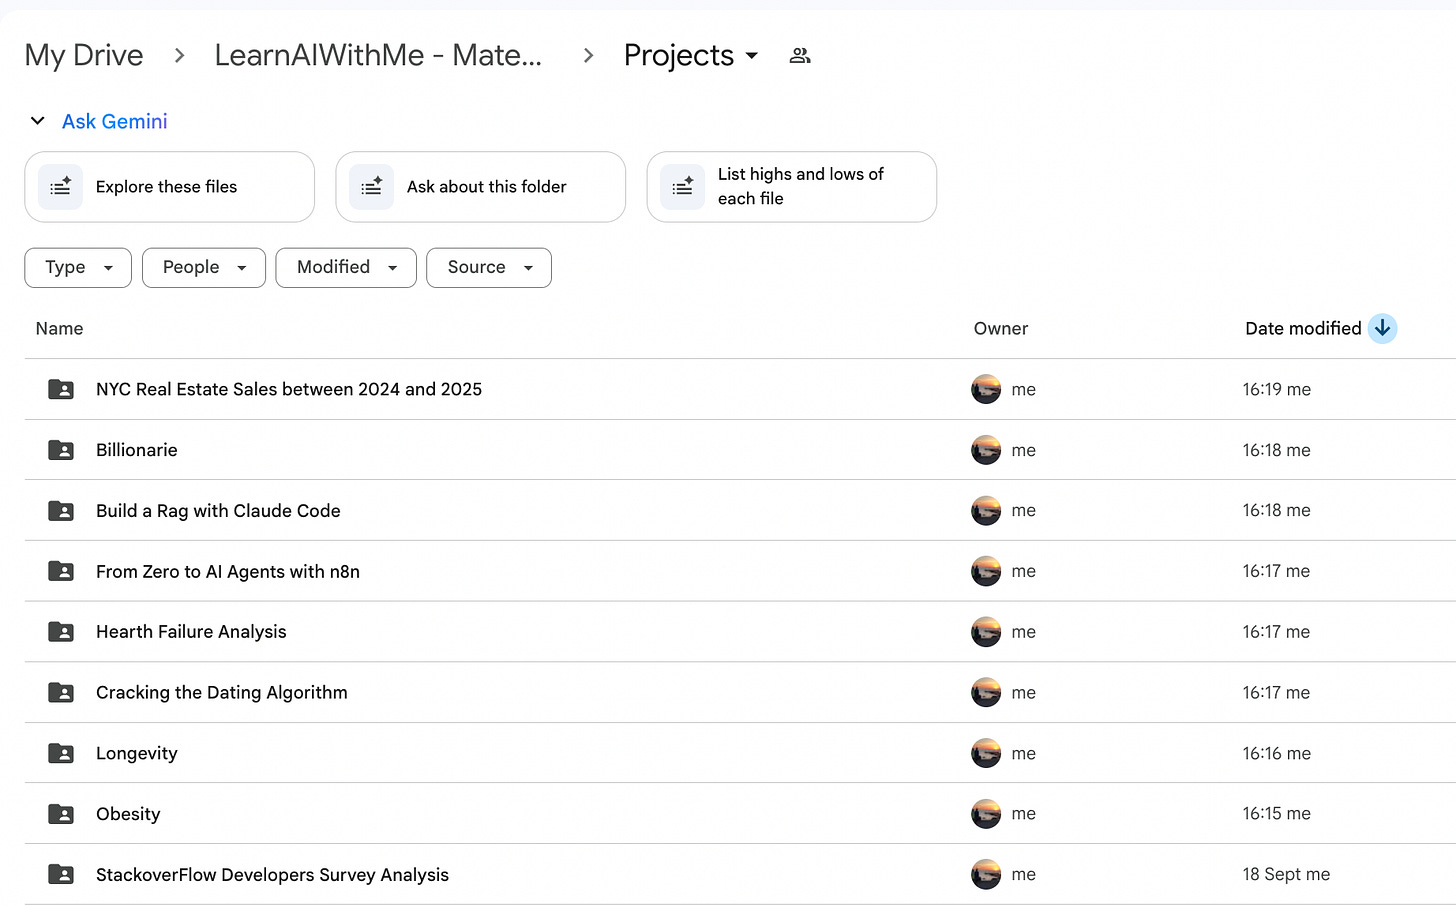
As usual, the solution includes code and a slide(above) that were already uploaded to the gDrive, where paid subscribers can access.
Market inefficiencies don’t last.
Inside:
Neighborhoods trading 10% below value
Building classes at $607/sqft, beating luxury condos
The code that analyzed 77K transactions, and zones flipping in 36 days
and more insights.
Let’s start the analysis →


