
Data Project 15: AI Analyzed 25 Years of US Housing. What It Found Surprised Me.
What Would Take Days Now Takes Hours: Analyzing US Cities and States for Real Estate ROI using Prompts


Do you know which US city or state offers the best Return on investment for buying a house in 2025? Until yesterday, I didn’t have a clear answer either.
What would have taken days of manual research a few years ago now takes hours. But the shift isn’t just about speed; now it is available for everyone with the correct data and prompts.
All you have to do is upload your data to your AI and use the prompts that I give you to find a scientific answer to the following questions:
Which cities showed the highest price increase in the last 20 years?
Which states showed the highest price increase in the last 5 years?
Best & Worst Cities for Home Buying (Momentum Analysis)
Best & Worst States for Home Buying (Risk-Adjusted Analysis)
Seasonality Analysis - Best Time to Buy a Home
Missed Opportunities - What We Could Have Made (2015-2025)
Zillow
Zillow is a real estate marketing platform that's No. 1 right now, so we’ll use their data.
Let’s see the data specifics.
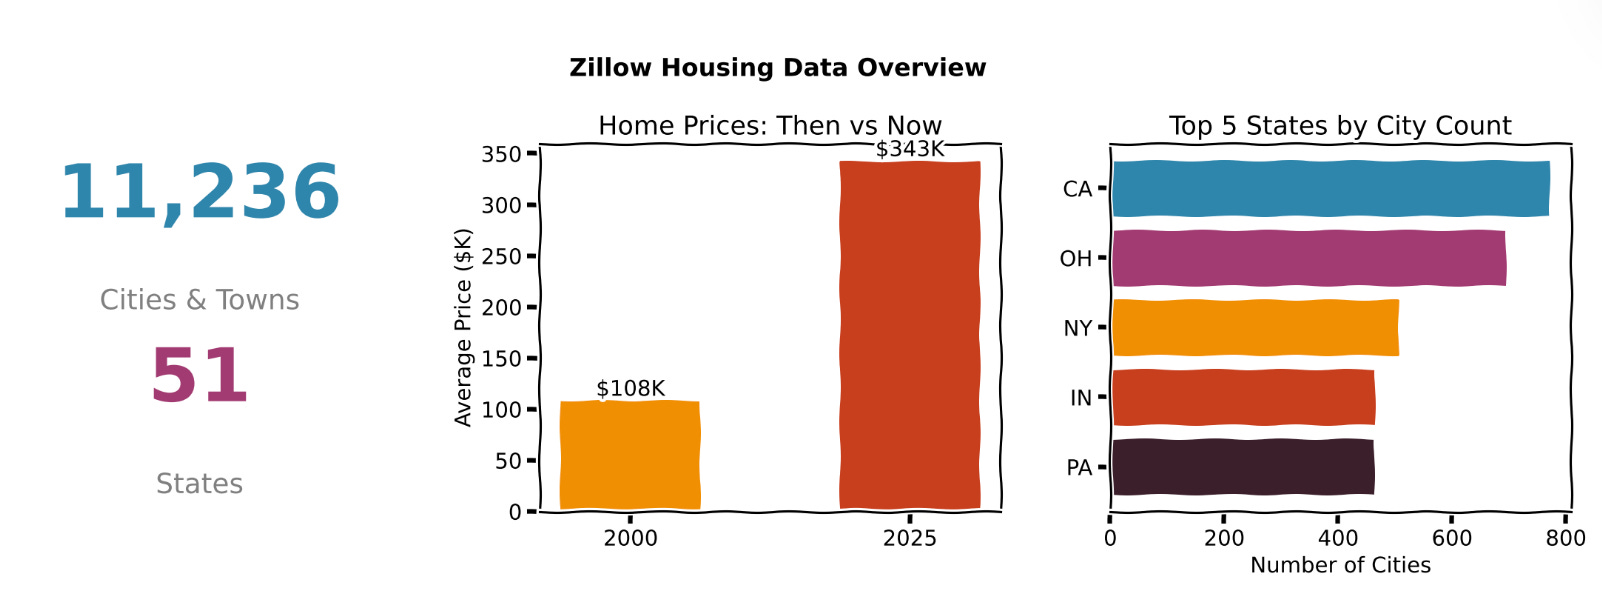
As you can see, the data spans from 2000 to 2025, covering 11,236 towns and cities across 51 states, along with the top five states by city count.
But how can I produce the image above? Let’s see the prompt I used to create this graph:
Create a hand-drawn style (XKCD) data overview chart with 3 panels using the attached Zillow housing dataset:
1. Key statistics (city count, state count)
2. Price comparison (2000 vs 2025)
3. Top 5 states by city count
I was using Claude, by the way. Let’s start with question 1.
Which cities showed the highest price increase in the last 20 years?
In this question, we examined four angles to get the full picture.
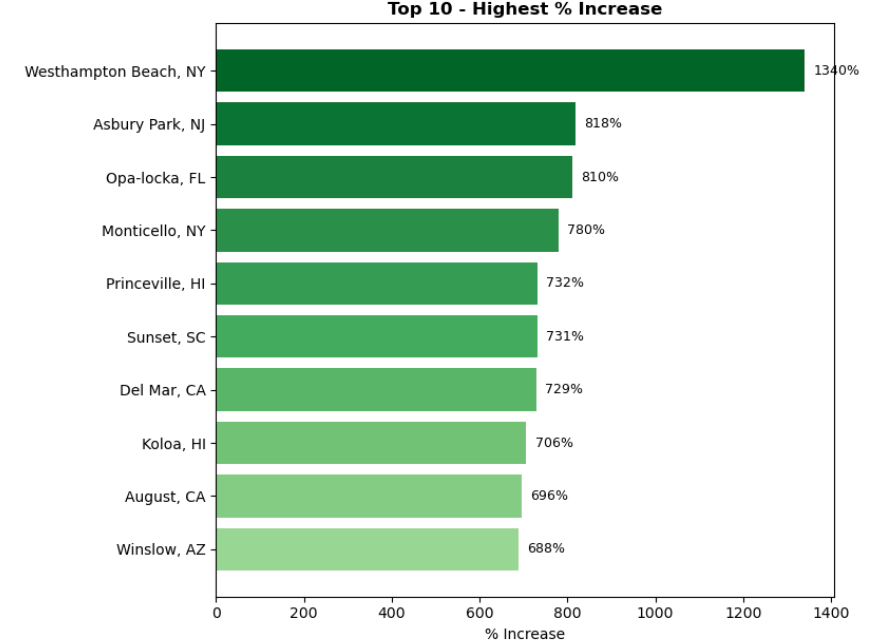
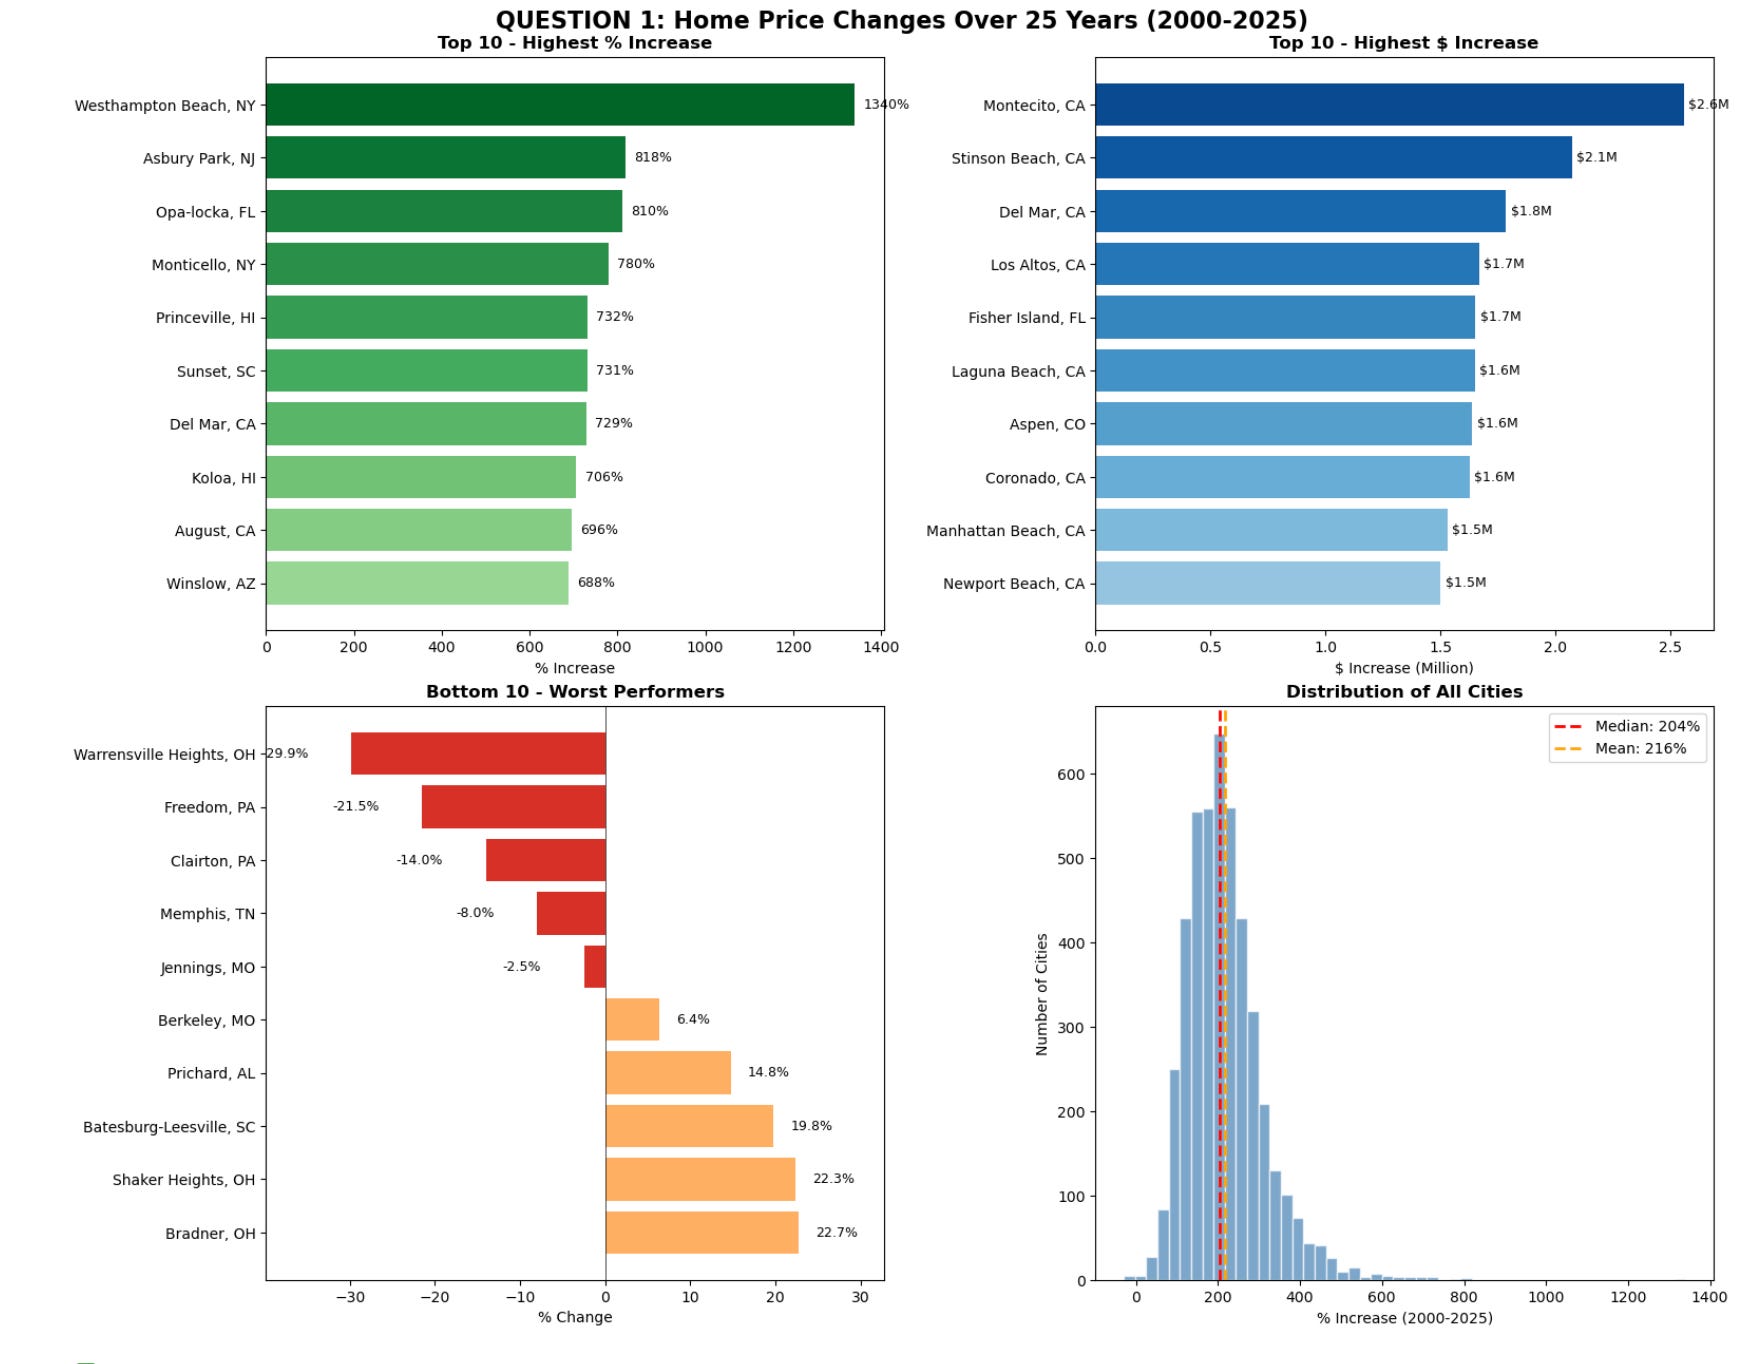
First, we found the top 10 cities with the highest percentage increase. Westhampton Beach, NY, crushed it with a 1,340% jump, turning a modest beach town into millionaire territory.
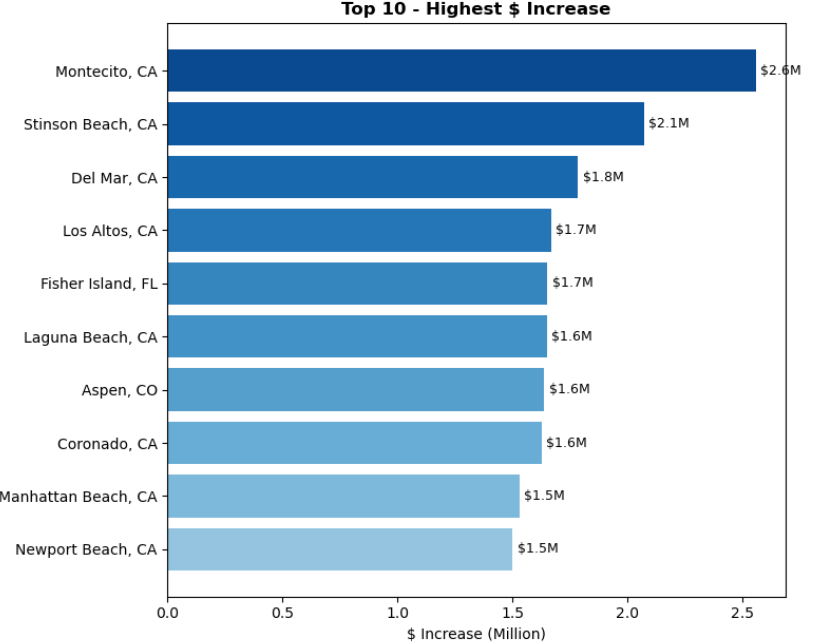
Next, we checked which cities gained the most in actual dollar terms. Montecito, CA leads with $2.6M increase, that’s California luxury for you.
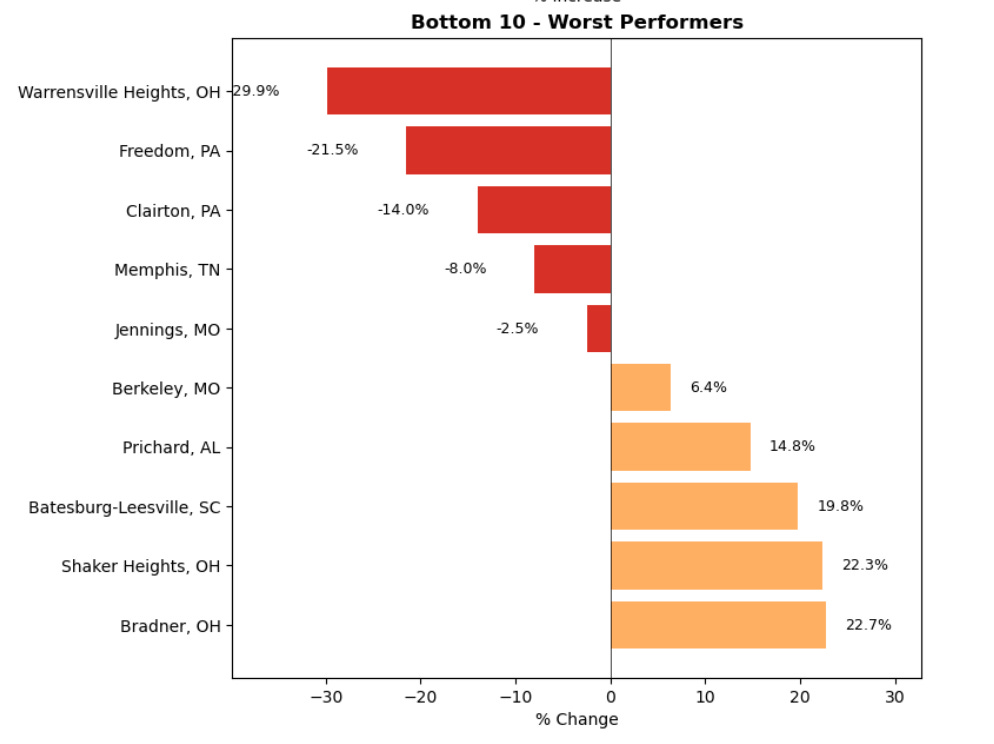
But what about the losers? Five cities actually lost value over 25 years. Warrensville Heights, OH, dropped nearly 30%. Ouch.
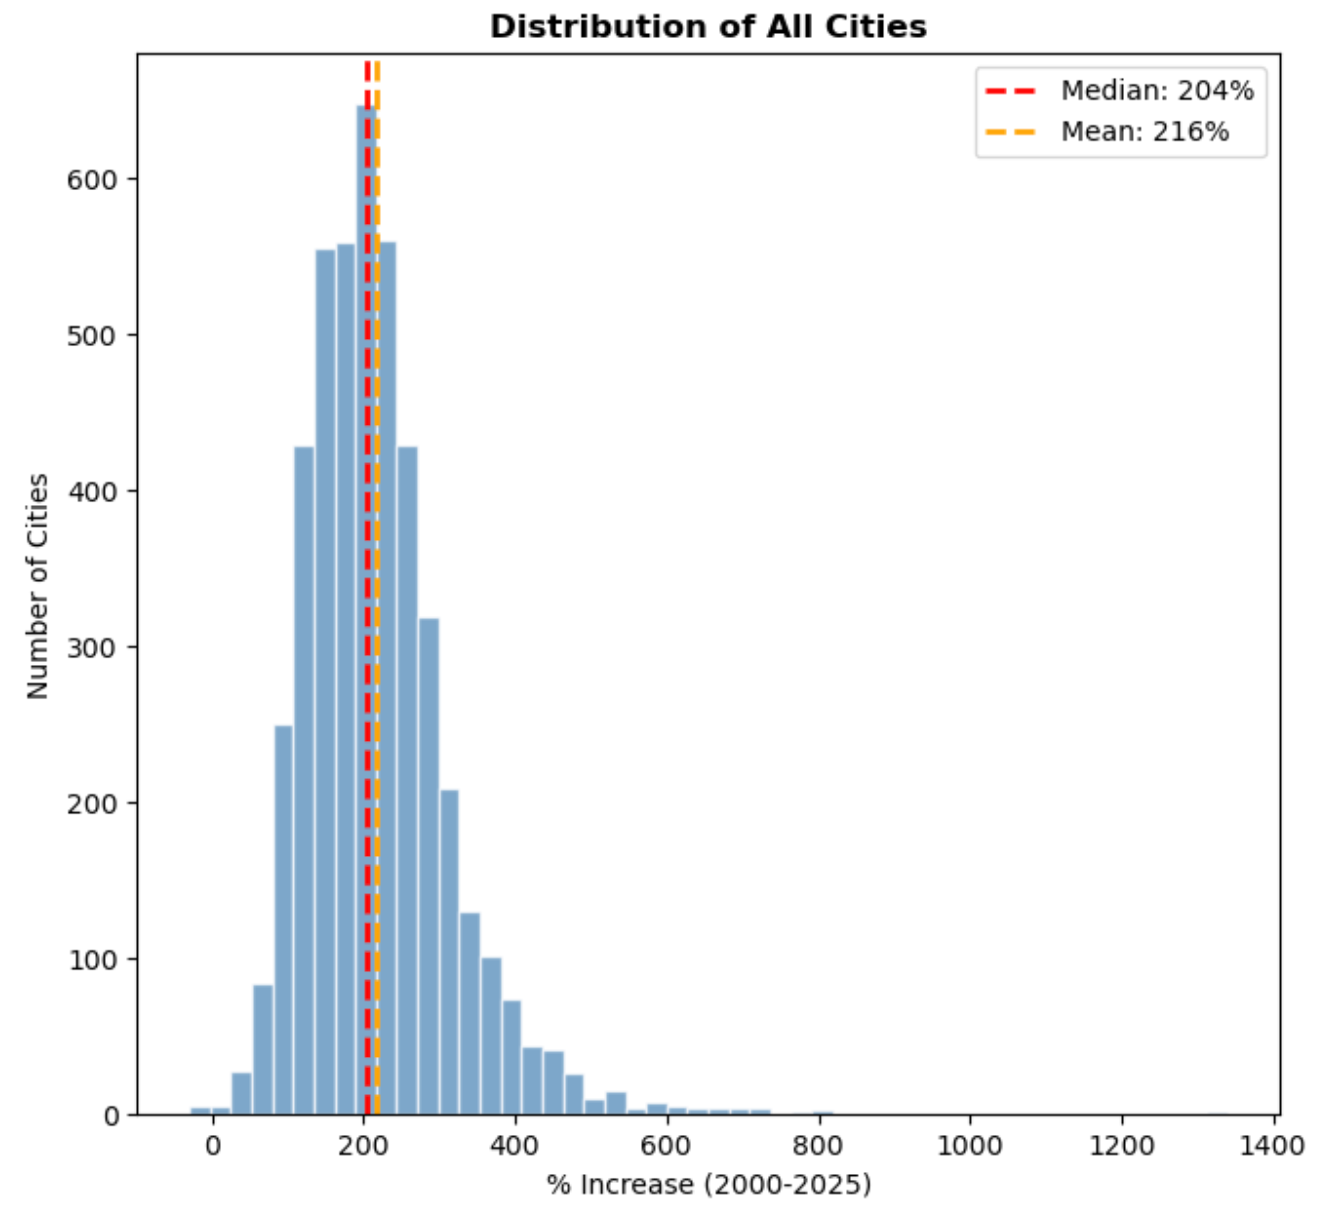
Finally, here’s how all 4,547 cities are distributed. Median increase is 204%, meaning a typical home tripled in value since 2000.
Here is the prompt to regenerate these findings.
Analyze 25-year home price changes (2000-2025) with 4 panels:
1. Top 10 cities - highest % increase
2. Top 10 cities - highest $ increase
3. Bottom 10 - worst performers
4. Distribution histogram with median/mean lines
Use attached data.
Now let’s see the output.
Let’s continue with the remaining seven questions. You don’t need to be a data scientist; use the prompts and the data, and that’s it.