
5 Data Projects with Source Codes That Will Take You Another Level
Data Projects that will get you there


Data-related jobs are increasing, capturing the attention of engineers, tech enthusiasts, and even those without a technical background. Thanks to advancements in our tools, one does not need to know math or statistics to secure a data-related job.
One of the easiest ways to land these jobs is by creating a portfolio project that will impress recruiters. I assure you, once you do this, your CV will become less important as recruiters will focus on your current abilities rather than your past experiences.
In this article, I’ll explain five data projects that will demonstrate your exceptional skills. You can also access their source codes by becoming a paid subscriber. They are available on our Notion page. However, you can read this article and gain insights about them. Let’s get started!
Heart Failure Mortality Prediction
In this data project, we’ll explore heart failure mortality prediction using six different classification algorithms
Random Forest
Logistic Regression
K-Nearest Neighbors (KNN)
Decision Tree
Support Vector Machine (SVM),
Naive Bayes
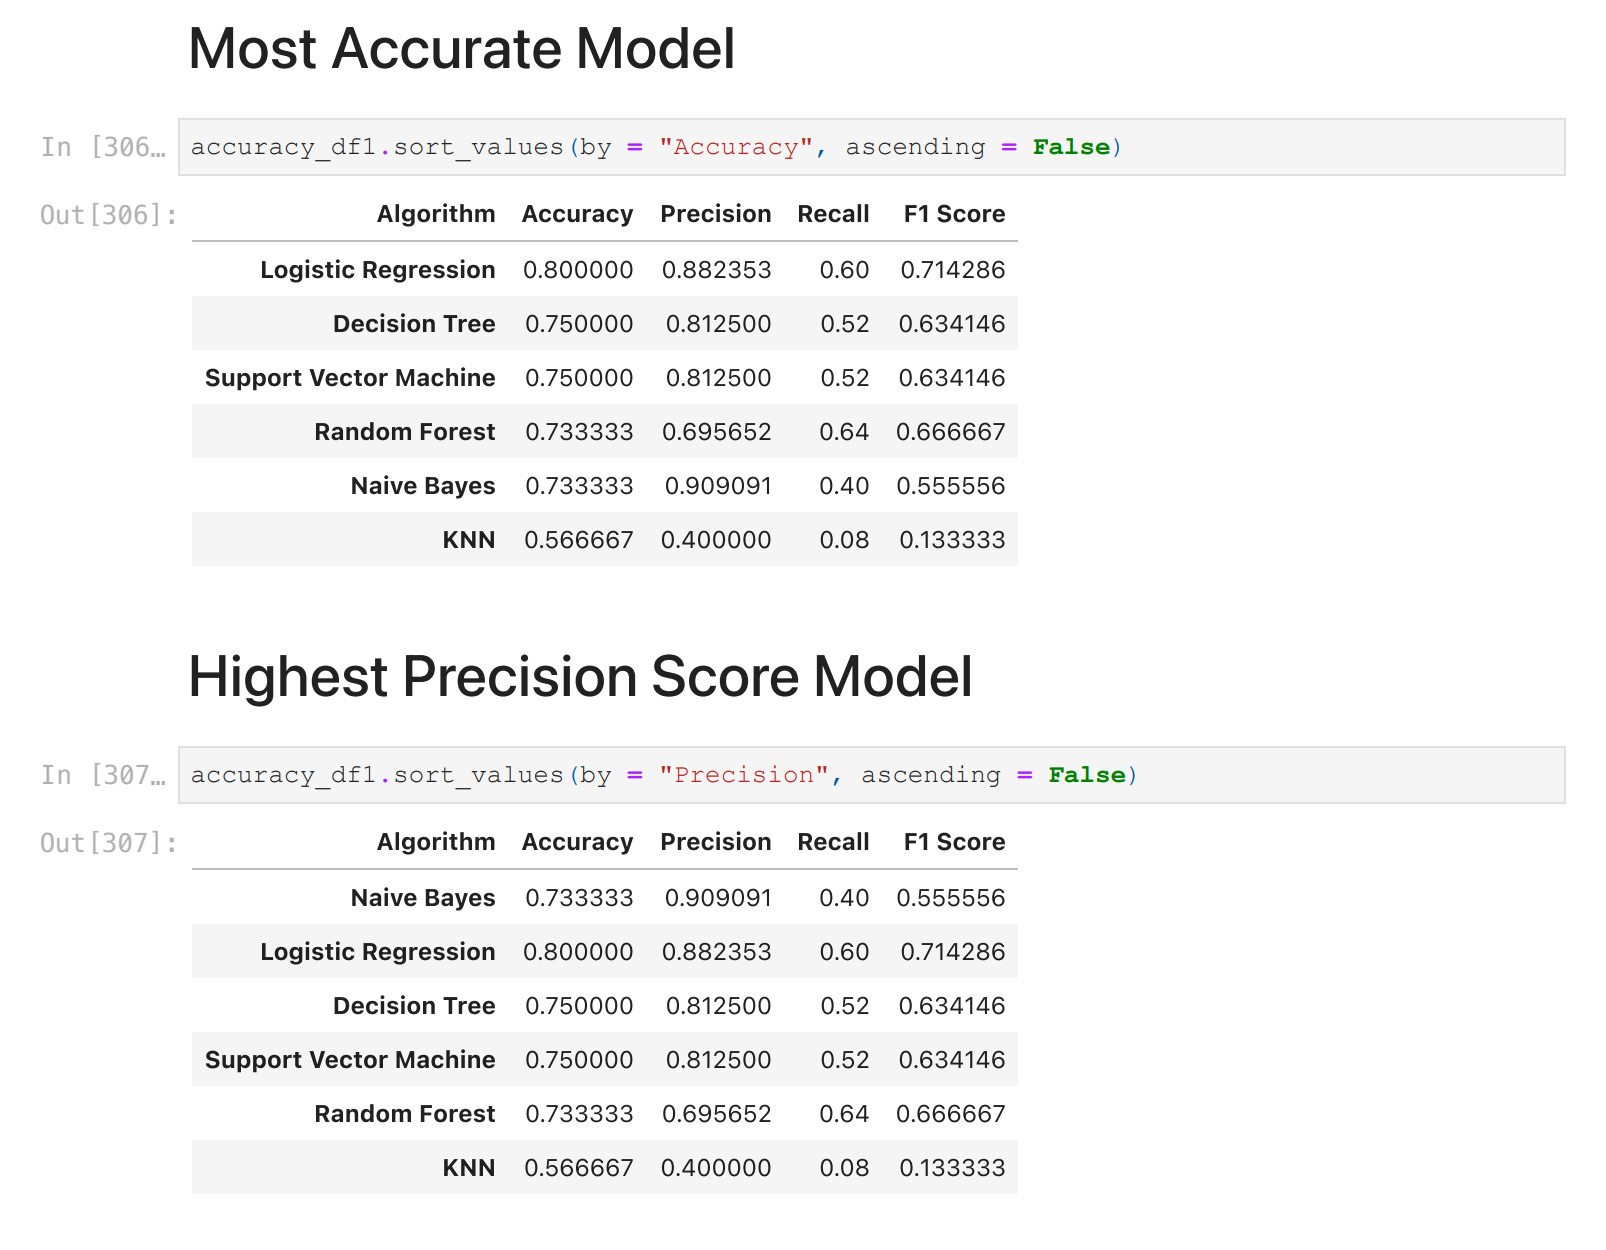
We aim to find the most effective algorithm based on various performance metrics. To do that, we compared the algorithms;
Data Source: The dataset originates from the UCI Machine Learning Repository.
Analysis Approach:
Data Preparation: Initial checks and cleaning ensure the dataset's readiness for analysis.
Algorithm Testing: The performance of each algorithm is assessed using metrics like Accuracy and F1 Score.
Feature Engineering: Dimensionality reduction through PCA and redundancy checks via correlation analysis streamline the feature set.
Model Selection: Cross-validation is employed to select the most robust model against overfitting.
Results: Key findings highlight the superior performance of Random Forest and Logistic Regression in precision and accuracy.
How to be a billionaire?

In this data project, we went into the world of billionaires. Here’s a snapshot of what you will discover:
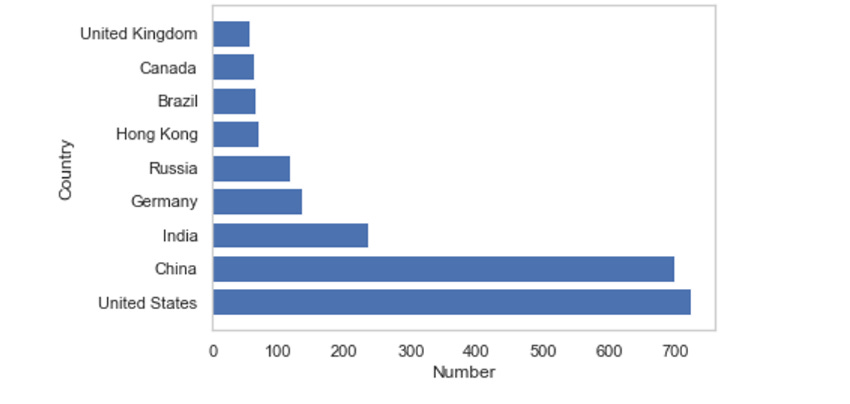
Global Distribution:
Countries with the Most and Least Billionaires: Explore which countries are home to the most billionaires and which have the fewest.
Billionaire Density: Analysis of billionaires per million inhabitants reveals exciting trends in wealth concentration in various countries.
Continental Distribution:
Europe, Asia, and the Americas: Visual representations and data show billionaires' distribution across continents, highlighting regions with significant wealth accumulation.
Top Billionaires:
Who Are They?: The following is a comprehensive view of the top 10 billionaires in the world; their ranking and how much they are estimated to be worth.
Sources of Wealth:
Industry Insights: Find out where exactly the billionaires get their money using the following simple tree maps for the top main and overall sectors.
Interactive Elements:
Graphs and Charts: The tree maps will layout the distribution of billionaire wealth in different regions and industries.
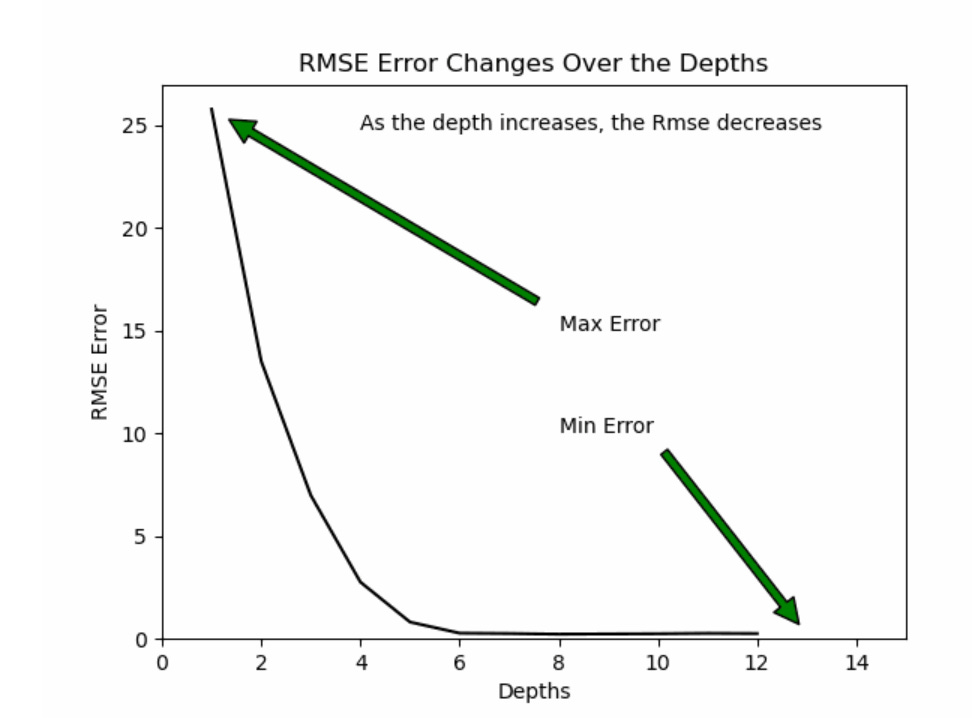
Energy Efficiency Analysis
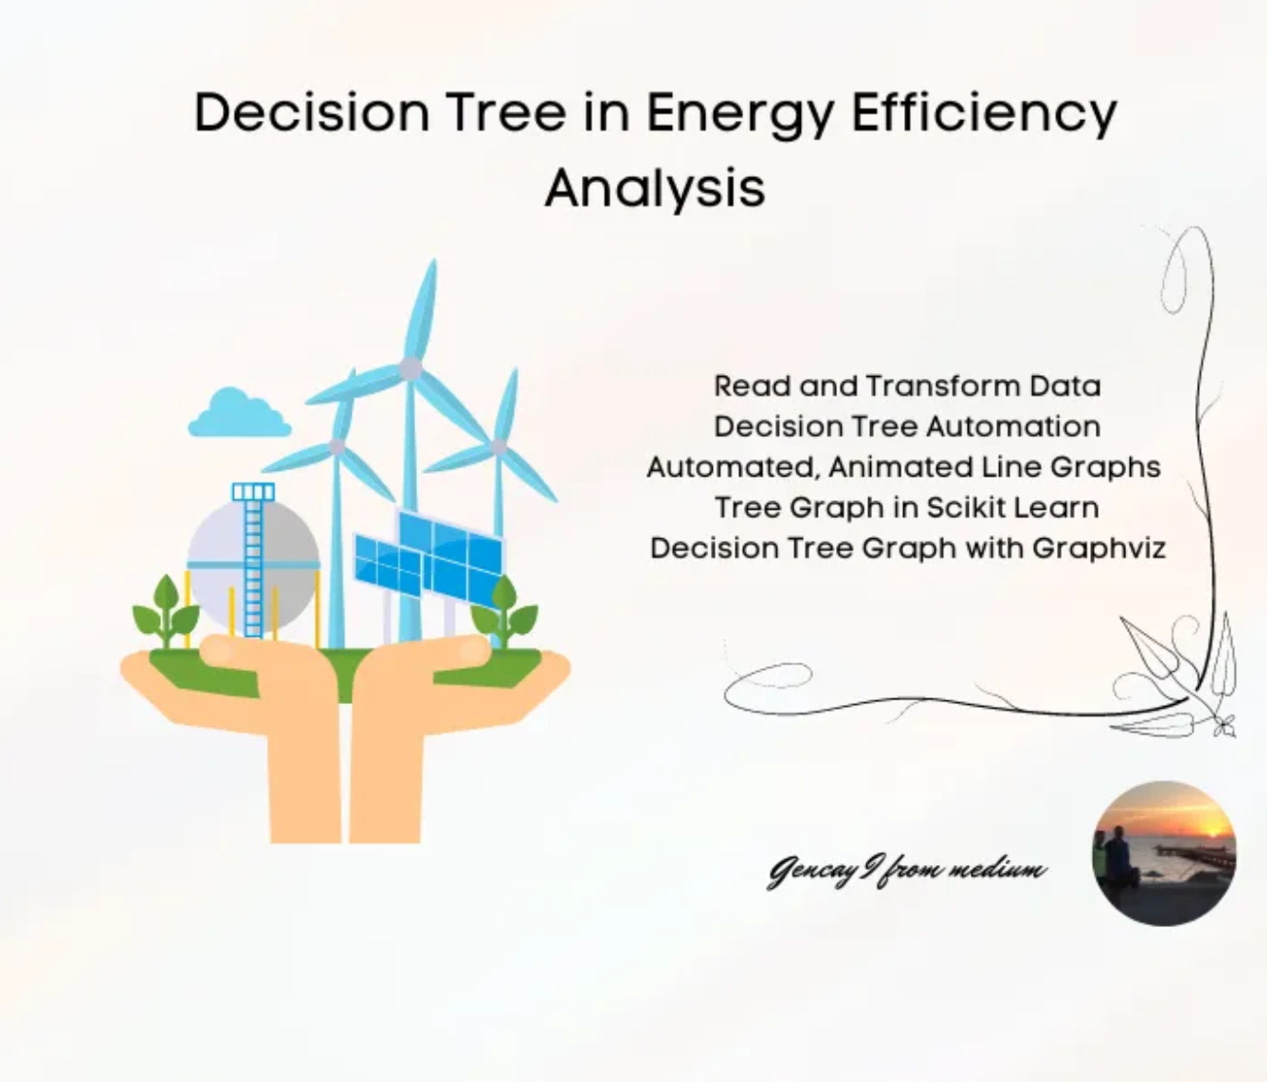
This project involves the development and deployment of a Decision Tree model that predicts the heating load of buildings using machine learning techniques for input and computation handling.
Data Source: Data from the UC Irvine Machine Learning Repository
Methodology:
Data Preparation: The initial and final dataset structure is analyzed to guarantee the correctness of the arrangement for further analysis.
Libraries and Tools: Python libraries are loaded.
Exploratory Analysis: A comprehensive exploratory analysis has been carried out to display the statistical distribution and presence of outliers.
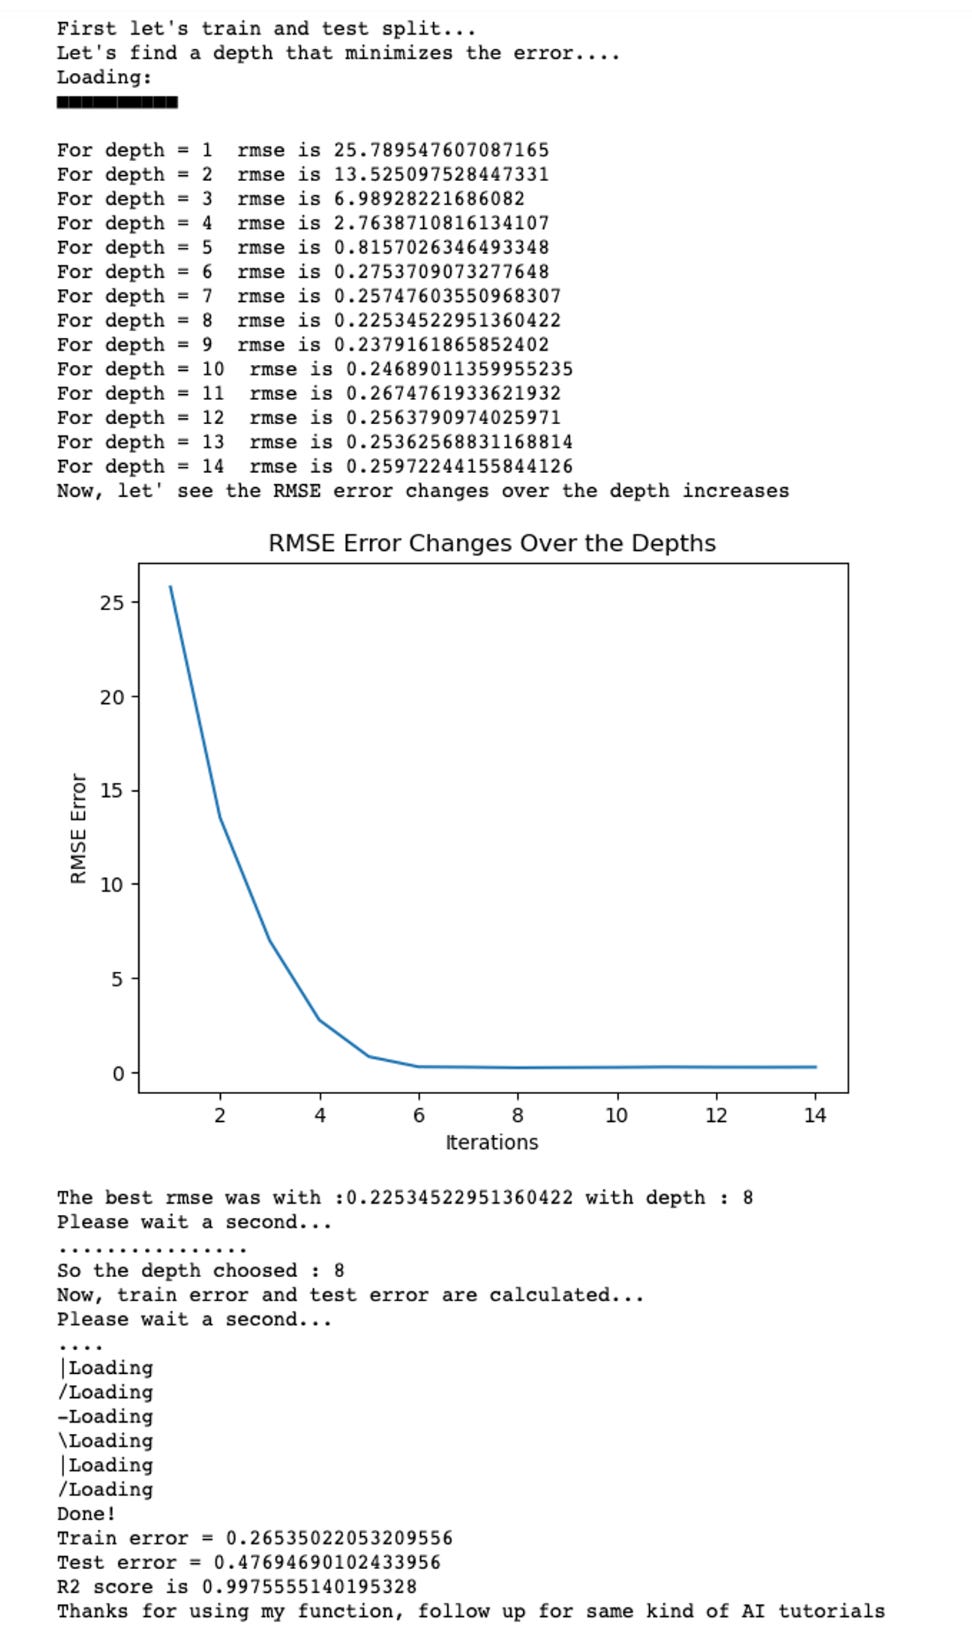
Model Building: The implementation of the decision tree model required the selection of variables, a train-test split, and grid search optimization.
Automation and Visualization: Automation of the learning of the model is carried out on the additional script with the necessary grid searching of the parameters.
Feature Selection: Correlation analysis is used to eliminate redundant features, improving model efficiency.
The Decision Tree analysis is an extensive data science tool that not only predicts heating load but also serves as an example of automation and simplification of complex data science processes, thereby serving an educational role for future data scientists.
Life Longevity Factors

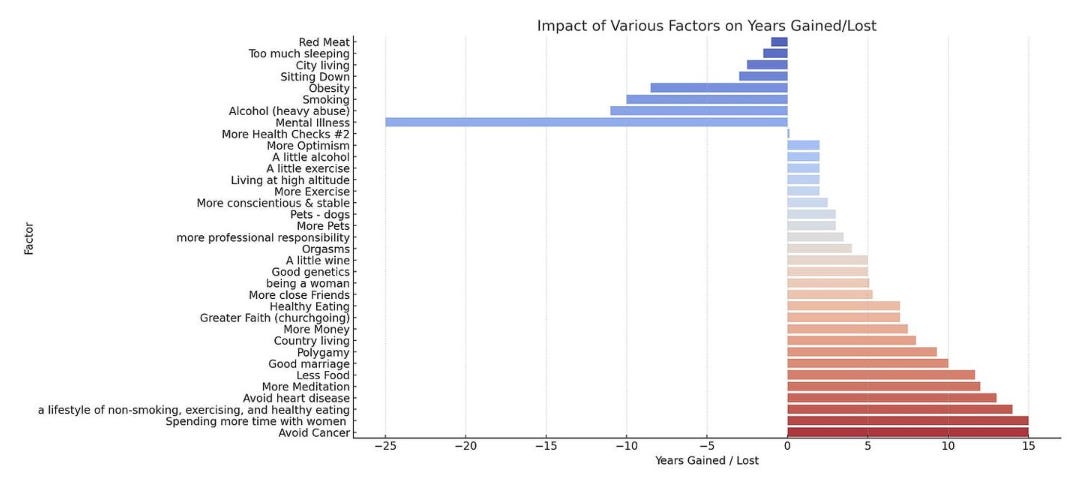
In this data project, we analyze life longevity factors , visualized to highlight the impacts of various lifestyle choices on life expectancy.
Key Insights:
Positive Influences:
Social and Healthful Living: Engaging in non-smoking, regular exercise, and healthy eating can extend life expectancy by up to 14 years.
Disease Prevention: Avoiding cancer and heart disease can add up to 15 and 13 years to life, respectively.
Mental Engagement and Companionship: Activities like meditation and spending time with women are linked to significant increases in longevity.
Negative Influences:
Mental Health: Mental illness is shown to reduce life expectancy by the most significant margin—25 years.
Substance Abuse: Heavy alcohol use and smoking are major detractors, potentially reducing life by 11 and 10 years, respectively.
Lifestyle Choices: Obesity and sedentary lifestyles are also critical factors, with substantial negative impacts on lifespan.
Controversial Truths:
Social vs. Financial Wealth: Time spent in companionship, particularly with women, is potentially more beneficial than financial wealth, suggesting a 15-year life extension compared to 7.5 years from income.
Lifestyle vs. Genetics: Lifestyle choices may outweigh genetic factors, with a potential 14-year gain from lifestyle adjustments versus a 5-year influence from genetics.
With this data analysis and actionable insights, we aimed at providing a comprehensive understanding of the factors that influence life longevity.
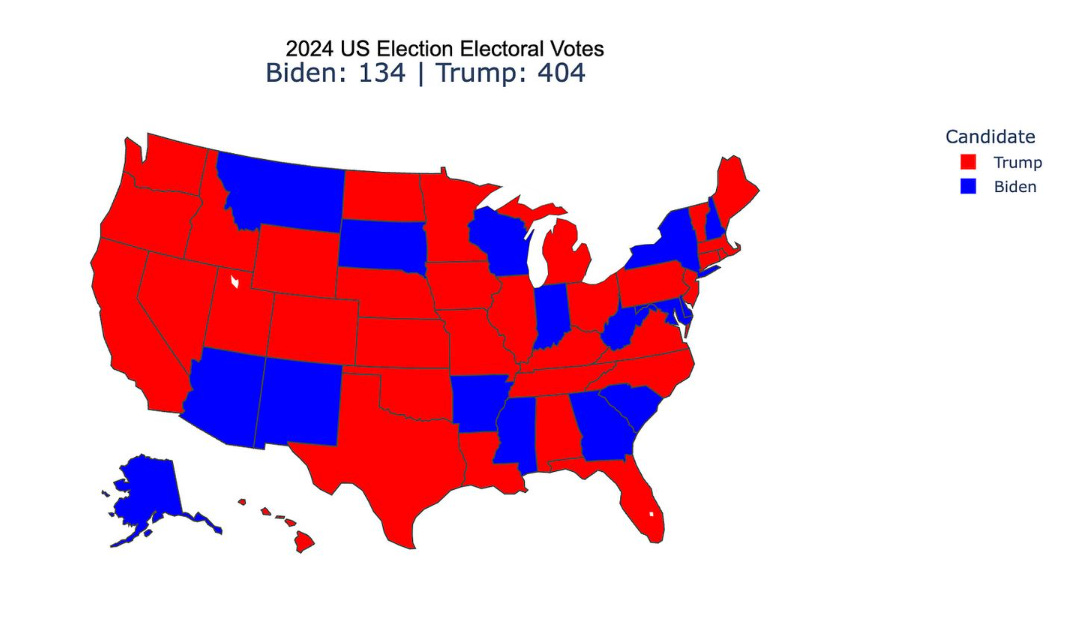
Election Prediction: A Data Project Will Get You a Job Offer

As 2024 approaches, the political landscape is buzzing with over 60 nations, including the U.S., gearing up for national elections. This presents a unique opportunity to us.
Data is sourced from nearly a million tweets about key political figures, stored and ready for analysis.
Project Steps:
#Step 1: Finding Dataset
Explanation: Use the Twitter API to scrape tweets related to election candidates, or start with a prepared Kaggle dataset for those new to data scraping.
#Step 2: Data Exploration
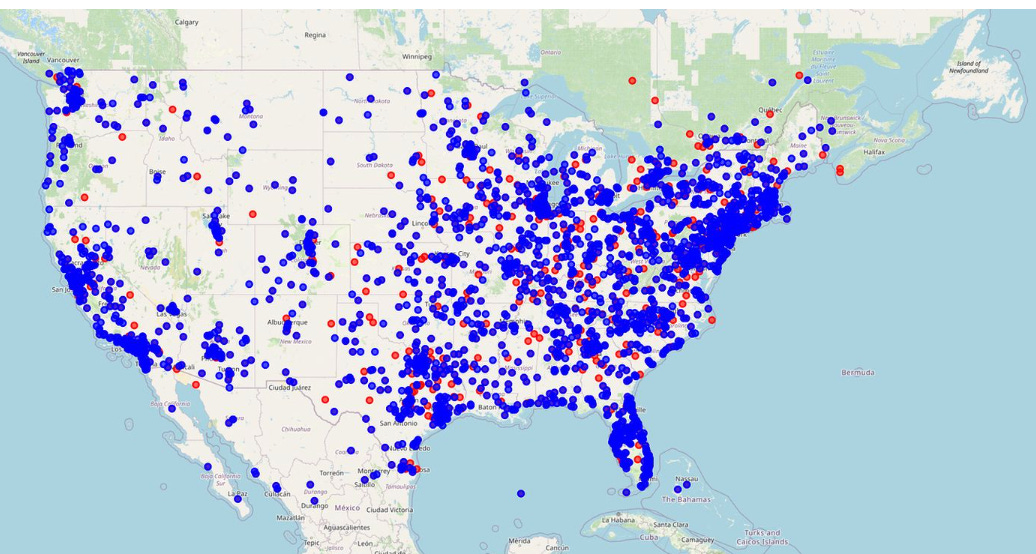
Explanation: Analyze the datasets focused on Trump and Biden, exploring tweet content, likes, retweets, and user locations to understand public sentiment and geographic distribution.
#Step 3: Data Preparation and Sentiment Analysis
Explanation: Clean and preprocess the tweets, then perform sentiment analysis to classify each tweet as positive, negative, or neutral, aiming to capture the public's mood towards the candidates.
#Step 4: Data Visualization
Explanation: Create visualizations such as sentiment maps using Folium or GeoPandas, illustrating the regional support or opposition for candidates, akin to professional electoral maps.
This project is not only a great way to sharpen your data science skills but also a strategic addition to your portfolio that can make a strong impression in job interviews.
Conclusion
After learning AI or Data Science, all you need to do is practice, and by offering these data projects, I want you to do this practice, by enjoying them!
All of these data projects, including their source codes, are available on our invited-only notion page.

Thanks for reading this one!
how to see the source code as I am paid subscrper